| __timestamp | Allegion plc | Cintas Corporation |
|---|---|---|
| Wednesday, January 1, 2014 | 853700000 | 1914386000 |
| Thursday, January 1, 2015 | 869100000 | 1921337000 |
| Friday, January 1, 2016 | 985300000 | 2129870000 |
| Sunday, January 1, 2017 | 1070700000 | 2380295000 |
| Monday, January 1, 2018 | 1173300000 | 2908523000 |
| Tuesday, January 1, 2019 | 1252300000 | 3128588000 |
| Wednesday, January 1, 2020 | 1178800000 | 3233748000 |
| Friday, January 1, 2021 | 1204900000 | 3314651000 |
| Saturday, January 1, 2022 | 1322400000 | 3632246000 |
| Sunday, January 1, 2023 | 1581500000 | 4173368000 |
| Monday, January 1, 2024 | 1668500000 | 4686416000 |
Igniting the spark of knowledge
In the competitive landscape of the industrial sector, Cintas Corporation and Allegion plc have showcased intriguing gross profit trends over the past decade. From 2014 to 2023, Cintas Corporation has consistently outperformed Allegion plc, with a remarkable 118% increase in gross profit, peaking at approximately $4.17 billion in 2023. Allegion plc, while showing steady growth, achieved a 85% increase, reaching around $1.58 billion in the same year.
Cintas Corporation's robust growth trajectory highlights its strategic market positioning and operational efficiency. In contrast, Allegion plc's steady climb reflects its resilience and adaptability in a dynamic market. Notably, the data for 2024 is incomplete, with Allegion plc's figures missing, indicating potential data collection challenges or reporting delays.
These trends underscore the importance of strategic planning and market adaptation in achieving financial success in the industrial sector.
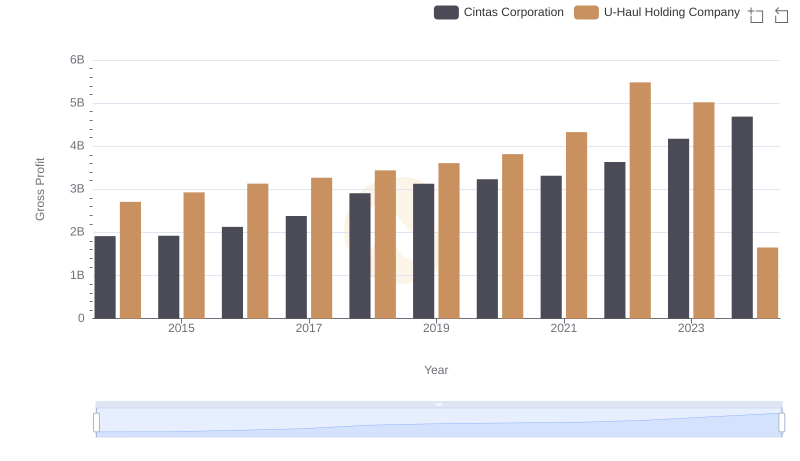
Gross Profit Analysis: Comparing Cintas Corporation and U-Haul Holding Company

Who Generates Higher Gross Profit? Cintas Corporation or Curtiss-Wright Corporation
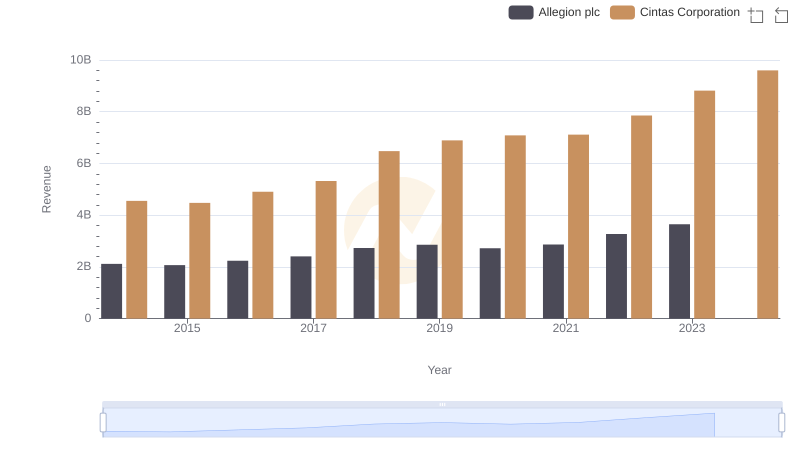
Annual Revenue Comparison: Cintas Corporation vs Allegion plc
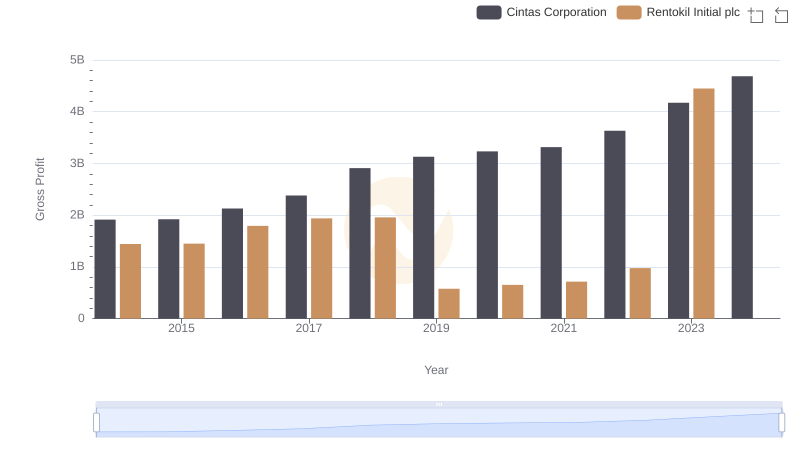
Gross Profit Trends Compared: Cintas Corporation vs Rentokil Initial plc
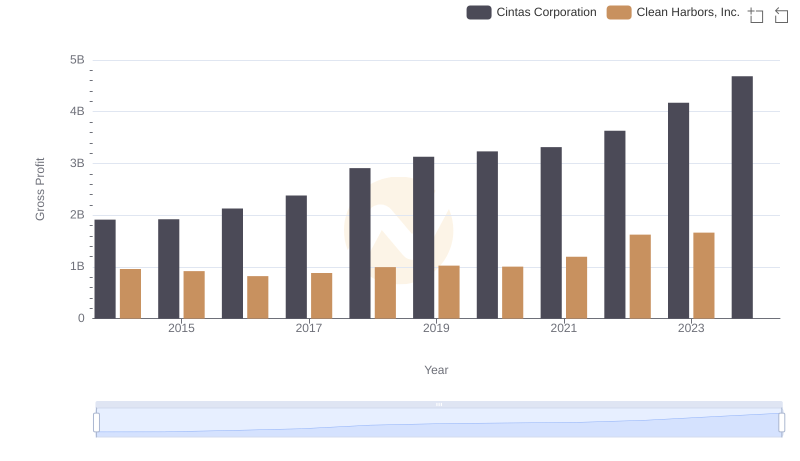
Gross Profit Trends Compared: Cintas Corporation vs Clean Harbors, Inc.
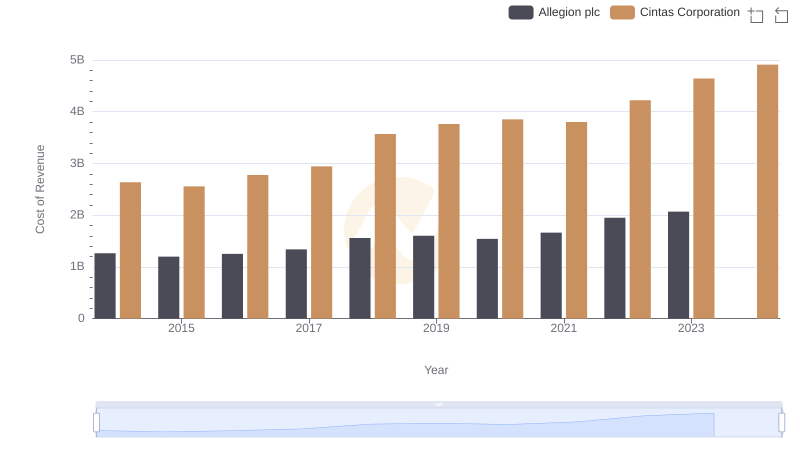
Analyzing Cost of Revenue: Cintas Corporation and Allegion plc
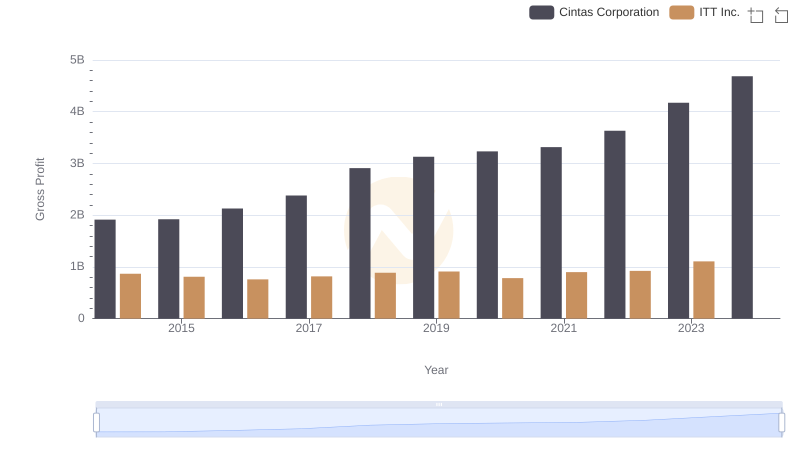
Cintas Corporation and ITT Inc.: A Detailed Gross Profit Analysis