| __timestamp | Allegion plc | Cintas Corporation |
|---|---|---|
| Wednesday, January 1, 2014 | 2118300000 | 4551812000 |
| Thursday, January 1, 2015 | 2068100000 | 4476886000 |
| Friday, January 1, 2016 | 2238000000 | 4905458000 |
| Sunday, January 1, 2017 | 2408200000 | 5323381000 |
| Monday, January 1, 2018 | 2731700000 | 6476632000 |
| Tuesday, January 1, 2019 | 2854000000 | 6892303000 |
| Wednesday, January 1, 2020 | 2719900000 | 7085120000 |
| Friday, January 1, 2021 | 2867400000 | 7116340000 |
| Saturday, January 1, 2022 | 3271900000 | 7854459000 |
| Sunday, January 1, 2023 | 3650800000 | 8815769000 |
| Monday, January 1, 2024 | 3772200000 | 9596615000 |
Igniting the spark of knowledge
In the competitive landscape of corporate America, Cintas Corporation and Allegion plc have carved out significant niches. Over the past decade, Cintas has consistently outpaced Allegion in revenue growth. From 2014 to 2023, Cintas saw its revenue soar by approximately 94%, while Allegion's revenue increased by about 72%. This impressive growth trajectory highlights Cintas's strategic prowess in expanding its market share.
Cintas's revenue journey began at around $4.6 billion in 2014, reaching nearly $8.8 billion by 2023. In contrast, Allegion started with $2.1 billion and climbed to $3.7 billion in the same period. Notably, Cintas's revenue in 2024 is projected to hit $9.6 billion, while Allegion's data for 2024 remains unavailable, leaving room for speculation on its future performance.
These figures underscore the dynamic nature of the industry and the relentless pursuit of growth by these two corporate titans.
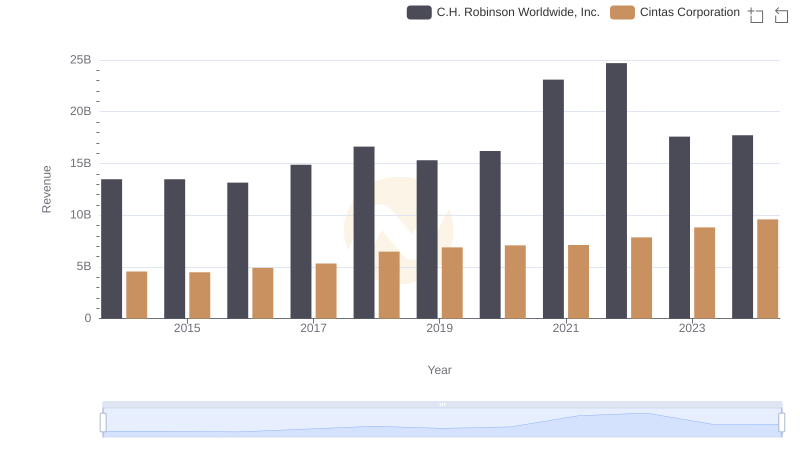
Revenue Showdown: Cintas Corporation vs C.H. Robinson Worldwide, Inc.
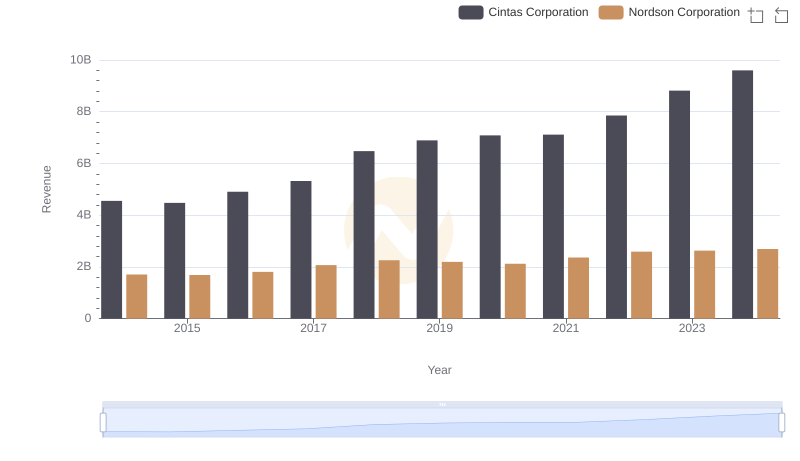
Cintas Corporation vs Nordson Corporation: Annual Revenue Growth Compared
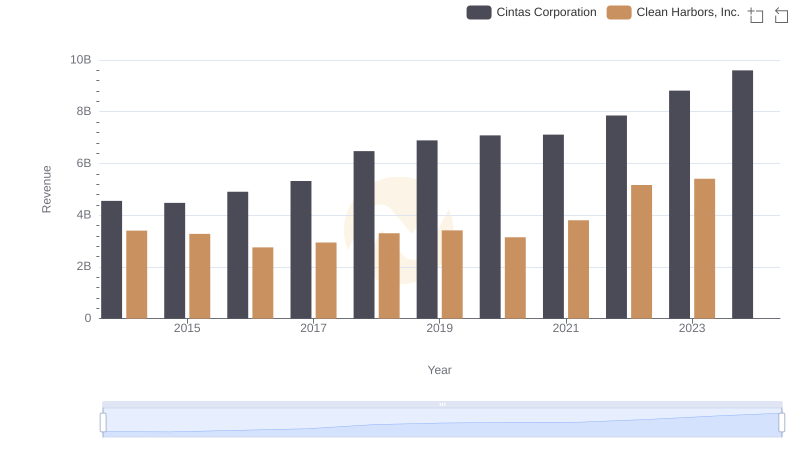
Revenue Insights: Cintas Corporation and Clean Harbors, Inc. Performance Compared
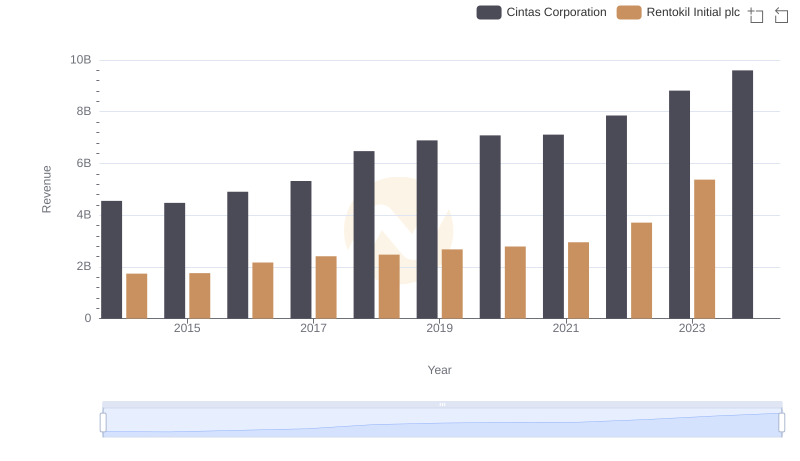
Cintas Corporation vs Rentokil Initial plc: Annual Revenue Growth Compared
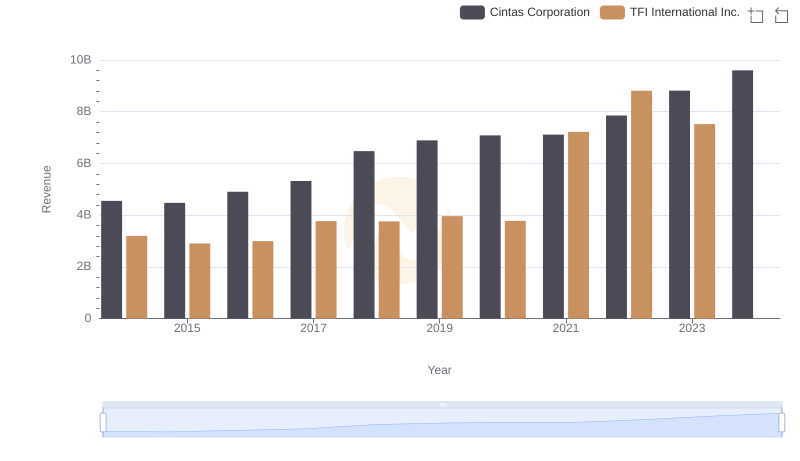
Cintas Corporation vs TFI International Inc.: Annual Revenue Growth Compared
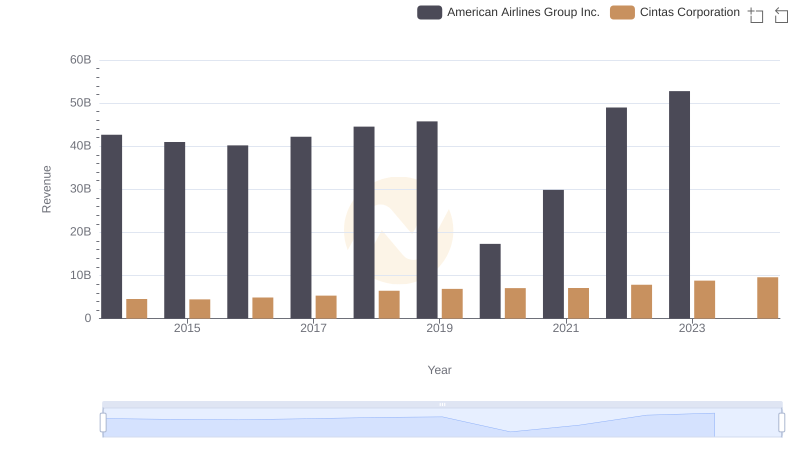
Revenue Showdown: Cintas Corporation vs American Airlines Group Inc.
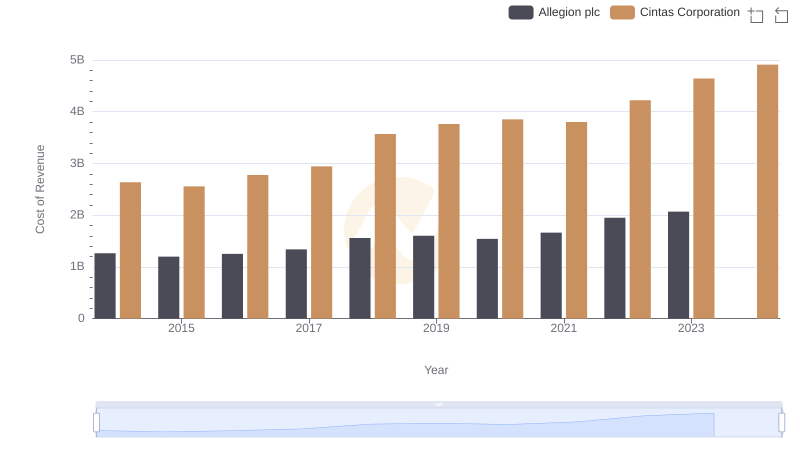
Analyzing Cost of Revenue: Cintas Corporation and Allegion plc
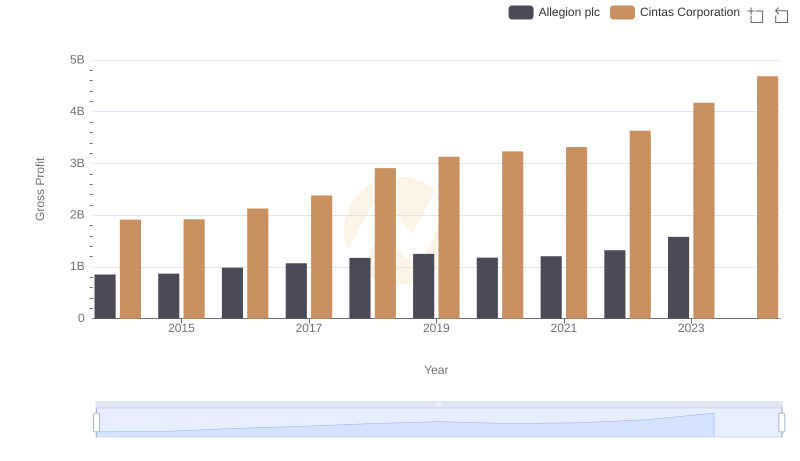
Gross Profit Trends Compared: Cintas Corporation vs Allegion plc