| __timestamp | AMETEK, Inc. | RB Global, Inc. |
|---|---|---|
| Wednesday, January 1, 2014 | 462637000 | 248220000 |
| Thursday, January 1, 2015 | 448592000 | 254990000 |
| Friday, January 1, 2016 | 462970000 | 283529000 |
| Sunday, January 1, 2017 | 533645000 | 323270000 |
| Monday, January 1, 2018 | 584022000 | 382676000 |
| Tuesday, January 1, 2019 | 610280000 | 382389000 |
| Wednesday, January 1, 2020 | 515630000 | 417523000 |
| Friday, January 1, 2021 | 603944000 | 464599000 |
| Saturday, January 1, 2022 | 644577000 | 539933000 |
| Sunday, January 1, 2023 | 677006000 | 743700000 |
| Monday, January 1, 2024 | 696905000 | 773900000 |
Cracking the code
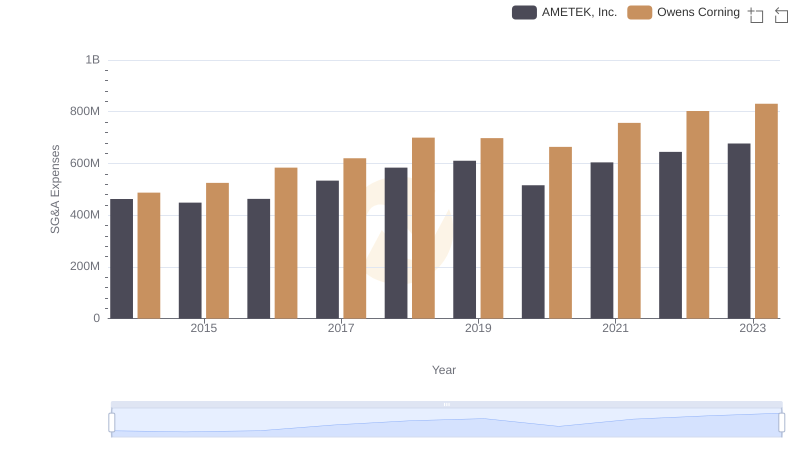
In the world of corporate finance, understanding a company's spending patterns can reveal much about its strategic priorities. Over the past decade, AMETEK, Inc. and RB Global, Inc. have showcased distinct trends in their Selling, General, and Administrative (SG&A) expenses. From 2014 to 2023, AMETEK's SG&A expenses grew by approximately 46%, reflecting a steady investment in operational efficiency and market expansion. In contrast, RB Global's SG&A expenses surged by nearly 200% during the same period, indicating a more aggressive approach to scaling and market penetration.
AMETEK's consistent growth in SG&A spending, peaking at 677 million in 2023, underscores its commitment to sustainable growth. Meanwhile, RB Global's dramatic increase, reaching 744 million in 2023, suggests a bold strategy to capture market share. These patterns offer a fascinating glimpse into the financial strategies of two industry leaders.
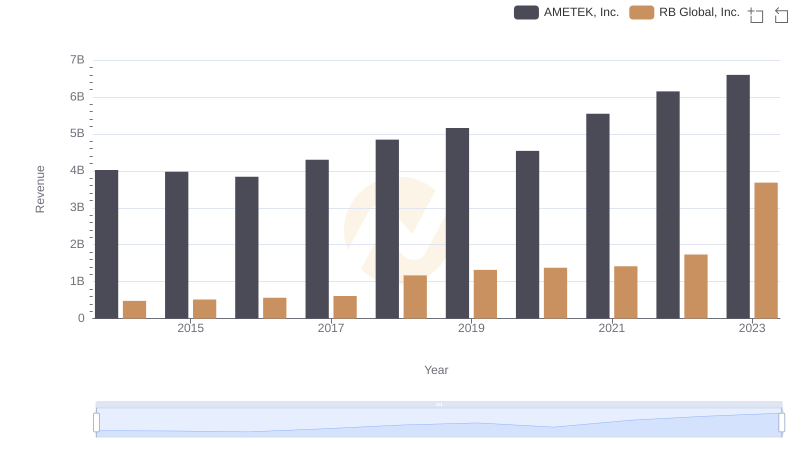
AMETEK, Inc. and RB Global, Inc.: A Comprehensive Revenue Analysis
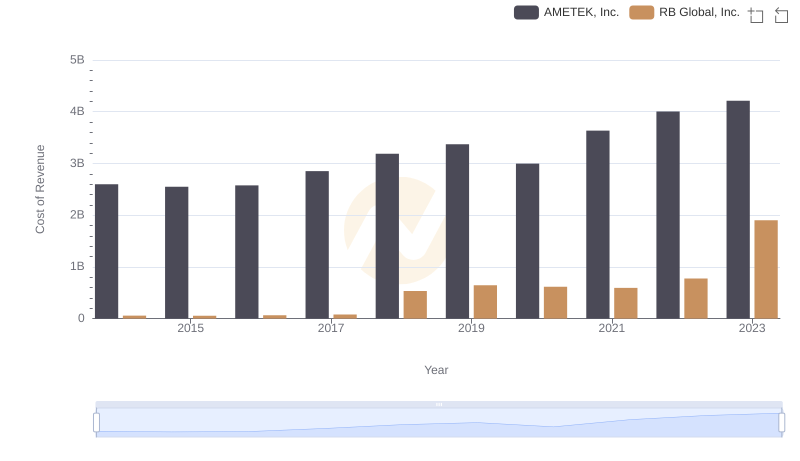
AMETEK, Inc. vs RB Global, Inc.: Efficiency in Cost of Revenue Explored
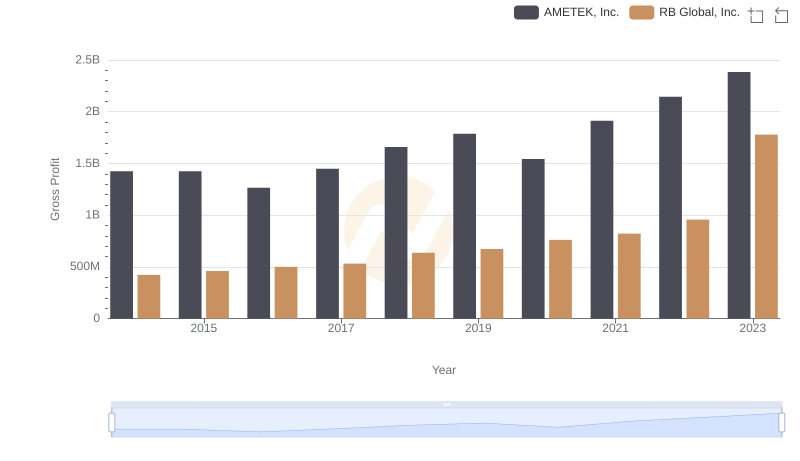
Who Generates Higher Gross Profit? AMETEK, Inc. or RB Global, Inc.
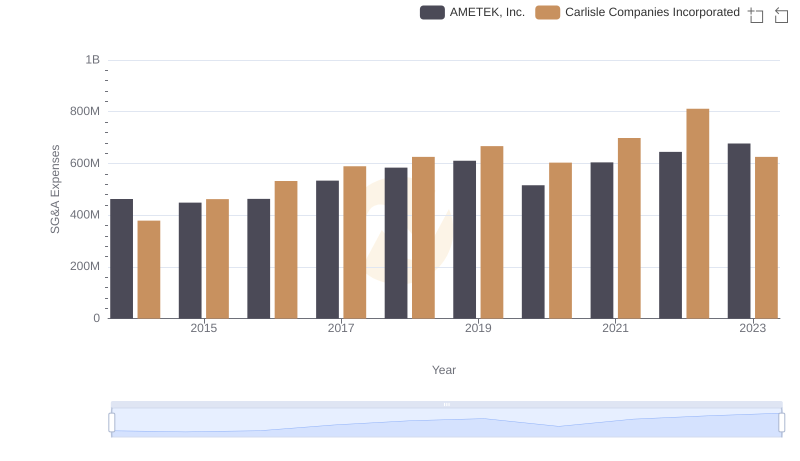
AMETEK, Inc. and Carlisle Companies Incorporated: SG&A Spending Patterns Compared
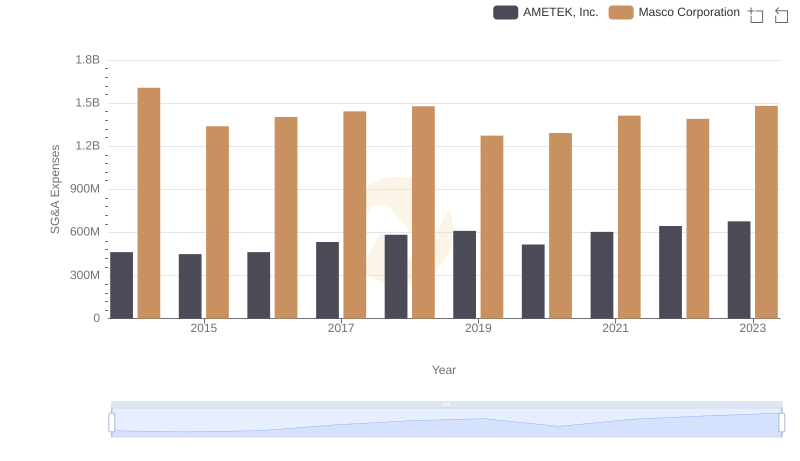
Cost Management Insights: SG&A Expenses for AMETEK, Inc. and Masco Corporation
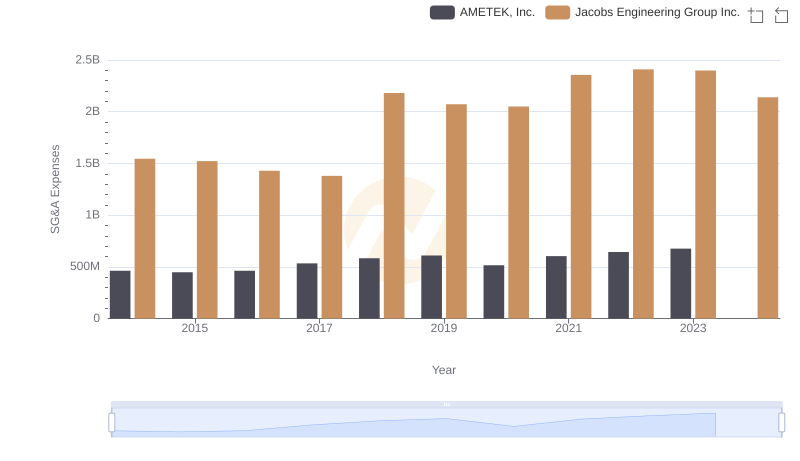
Who Optimizes SG&A Costs Better? AMETEK, Inc. or Jacobs Engineering Group Inc.
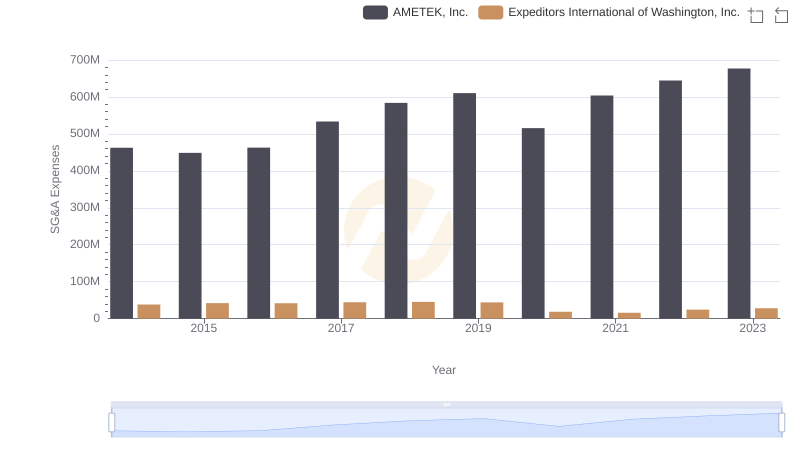
Operational Costs Compared: SG&A Analysis of AMETEK, Inc. and Expeditors International of Washington, Inc.
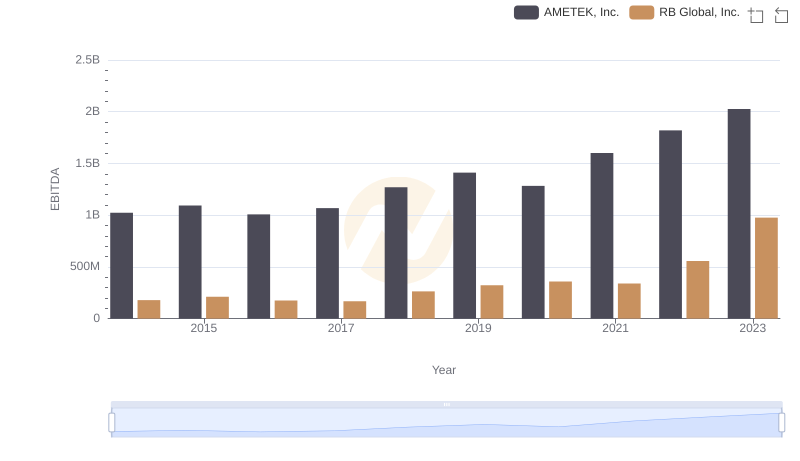
A Professional Review of EBITDA: AMETEK, Inc. Compared to RB Global, Inc.
Comparing SG&A Expenses: AMETEK, Inc. vs Owens Corning Trends and Insights