| __timestamp | AMETEK, Inc. | RB Global, Inc. |
|---|---|---|
| Wednesday, January 1, 2014 | 4021964000 | 481097000 |
| Thursday, January 1, 2015 | 3974295000 | 515875000 |
| Friday, January 1, 2016 | 3840087000 | 566395000 |
| Sunday, January 1, 2017 | 4300170000 | 610517000 |
| Monday, January 1, 2018 | 4845872000 | 1170026000 |
| Tuesday, January 1, 2019 | 5158557000 | 1318641000 |
| Wednesday, January 1, 2020 | 4540029000 | 1377260000 |
| Friday, January 1, 2021 | 5546514000 | 1416971000 |
| Saturday, January 1, 2022 | 6150530000 | 1733808000 |
| Sunday, January 1, 2023 | 6596950000 | 3679600000 |
| Monday, January 1, 2024 | 6941180000 | 4284200000 |
Unlocking the unknown
In the ever-evolving landscape of industrial technology and asset management, AMETEK, Inc. and RB Global, Inc. have emerged as formidable players. Over the past decade, AMETEK has consistently demonstrated robust growth, with its revenue surging by approximately 64% from 2014 to 2023. This growth trajectory underscores AMETEK's strategic prowess in expanding its market footprint and enhancing its product offerings.
Conversely, RB Global, Inc. has experienced a remarkable revenue increase of over 660% during the same period, highlighting its aggressive expansion and successful adaptation to market demands. The year 2023 marked a significant milestone for RB Global, with its revenue peaking at nearly $3.7 billion, a testament to its dynamic business model.
This comprehensive analysis offers a glimpse into the strategic maneuvers and market dynamics that have shaped these industry leaders, providing valuable insights for investors and industry enthusiasts alike.
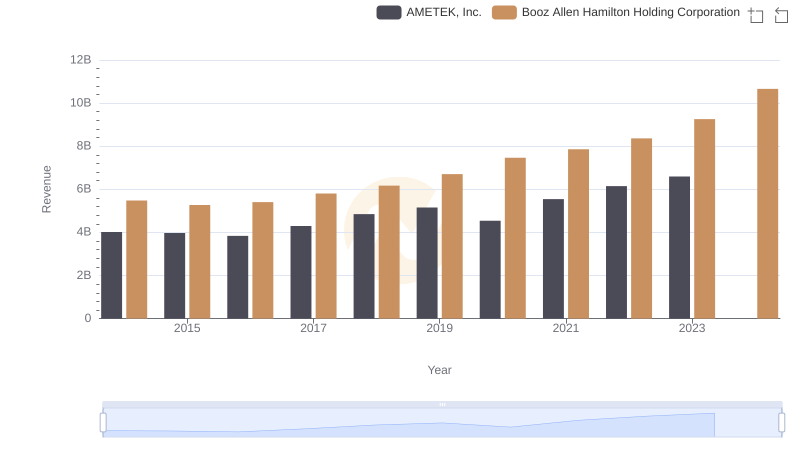
AMETEK, Inc. vs Booz Allen Hamilton Holding Corporation: Examining Key Revenue Metrics
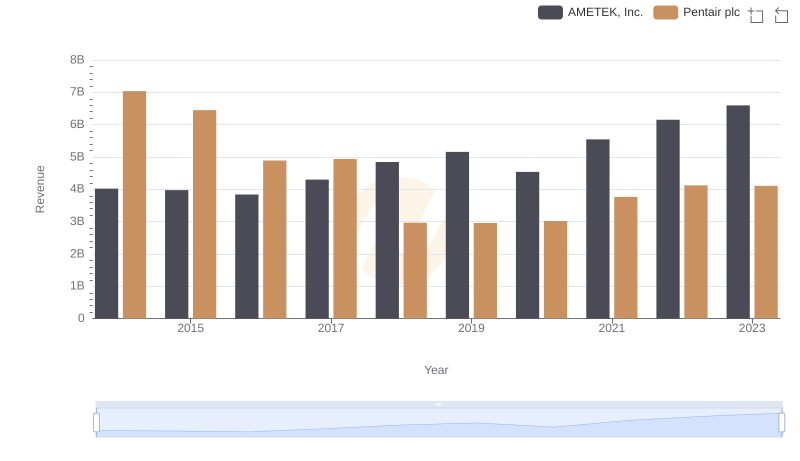
AMETEK, Inc. vs Pentair plc: Annual Revenue Growth Compared
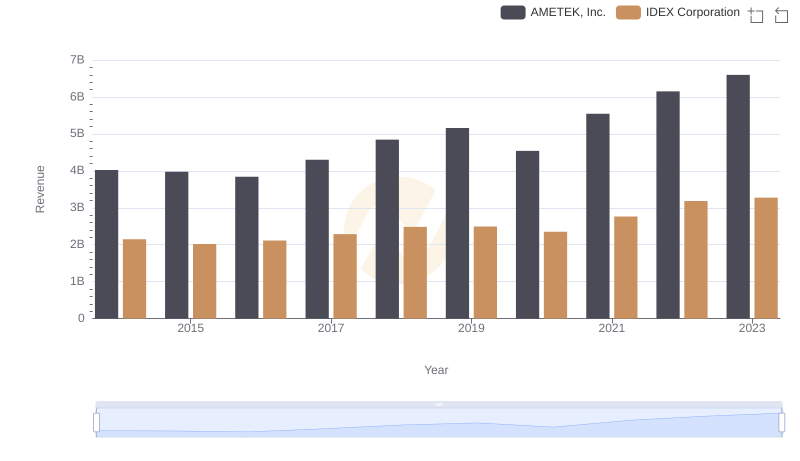
Who Generates More Revenue? AMETEK, Inc. or IDEX Corporation
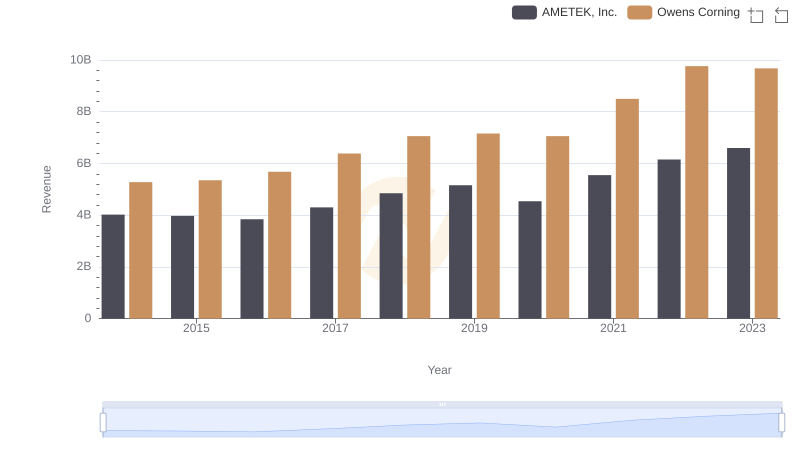
AMETEK, Inc. or Owens Corning: Who Leads in Yearly Revenue?
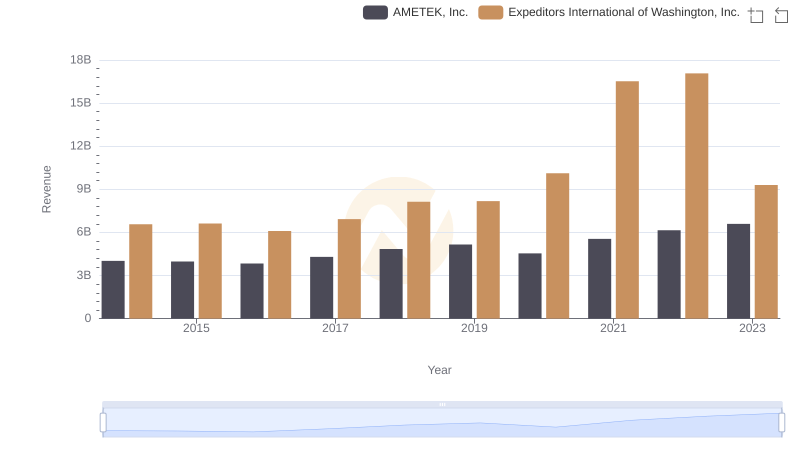
AMETEK, Inc. and Expeditors International of Washington, Inc.: A Comprehensive Revenue Analysis
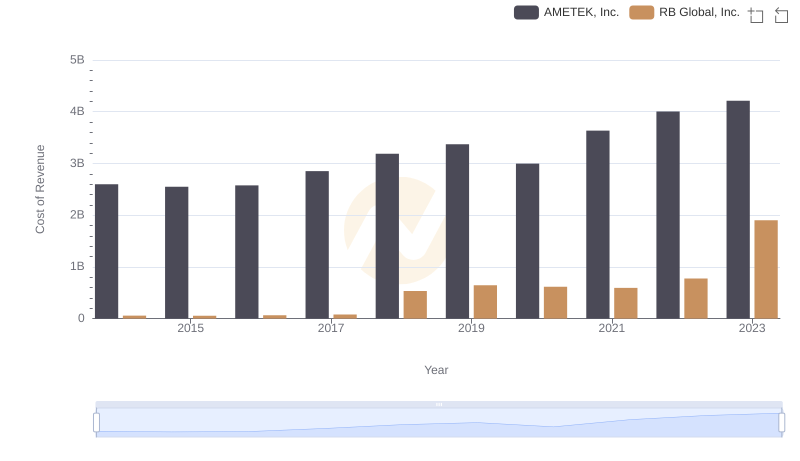
AMETEK, Inc. vs RB Global, Inc.: Efficiency in Cost of Revenue Explored
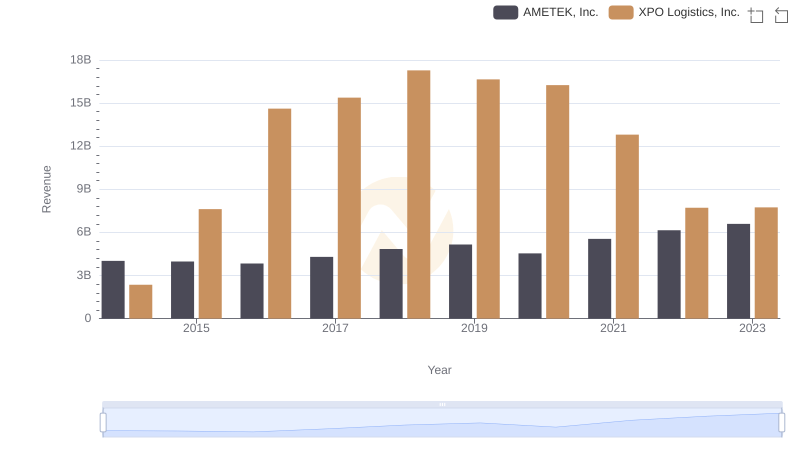
Who Generates More Revenue? AMETEK, Inc. or XPO Logistics, Inc.
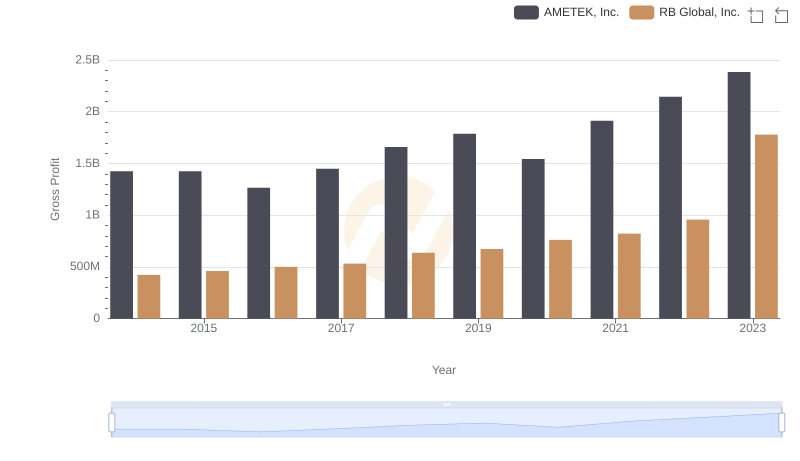
Who Generates Higher Gross Profit? AMETEK, Inc. or RB Global, Inc.
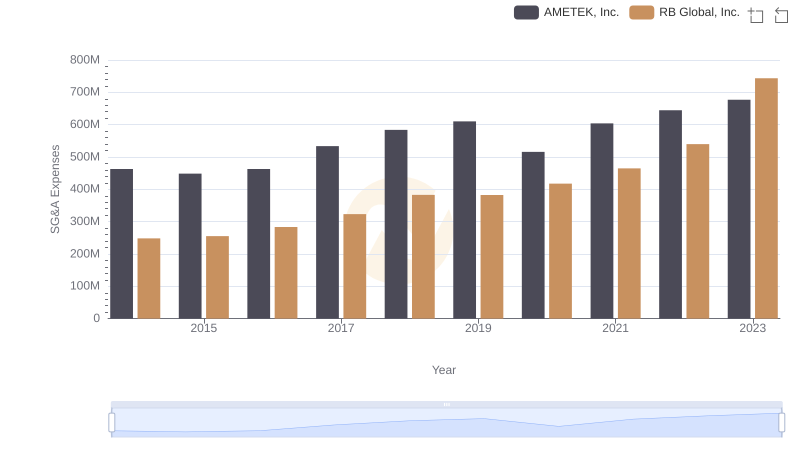
AMETEK, Inc. and RB Global, Inc.: SG&A Spending Patterns Compared
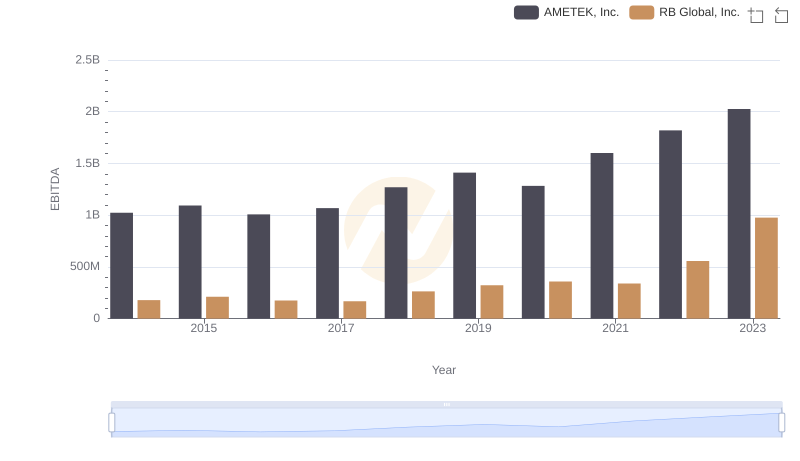
A Professional Review of EBITDA: AMETEK, Inc. Compared to RB Global, Inc.