| __timestamp | AMETEK, Inc. | Jacobs Engineering Group Inc. |
|---|---|---|
| Wednesday, January 1, 2014 | 2597017000 | 10621373000 |
| Thursday, January 1, 2015 | 2549280000 | 10146494000 |
| Friday, January 1, 2016 | 2575220000 | 9196326000 |
| Sunday, January 1, 2017 | 2851431000 | 8250536000 |
| Monday, January 1, 2018 | 3186310000 | 12156276000 |
| Tuesday, January 1, 2019 | 3370897000 | 10260840000 |
| Wednesday, January 1, 2020 | 2996515000 | 10980307000 |
| Friday, January 1, 2021 | 3633900000 | 11048860000 |
| Saturday, January 1, 2022 | 4005261000 | 11595785000 |
| Sunday, January 1, 2023 | 4212484999 | 12879099000 |
| Monday, January 1, 2024 | 0 | 8668185000 |
Cracking the code
In the competitive landscape of industrial manufacturing and engineering, cost efficiency is paramount. From 2014 to 2023, AMETEK, Inc. and Jacobs Engineering Group Inc. have demonstrated contrasting trends in their cost of revenue. AMETEK, Inc. has seen a steady increase, with a notable 62% rise from 2014 to 2023, peaking at $4.2 billion. In contrast, Jacobs Engineering Group Inc. experienced fluctuations, with a 21% increase over the same period, reaching $12.9 billion in 2023. This divergence highlights AMETEK's consistent growth strategy, while Jacobs navigates a more volatile market. The data for 2024 is incomplete, indicating potential shifts in the coming year. Understanding these trends provides valuable insights into each company's operational strategies and market positioning, offering a glimpse into their future trajectories.
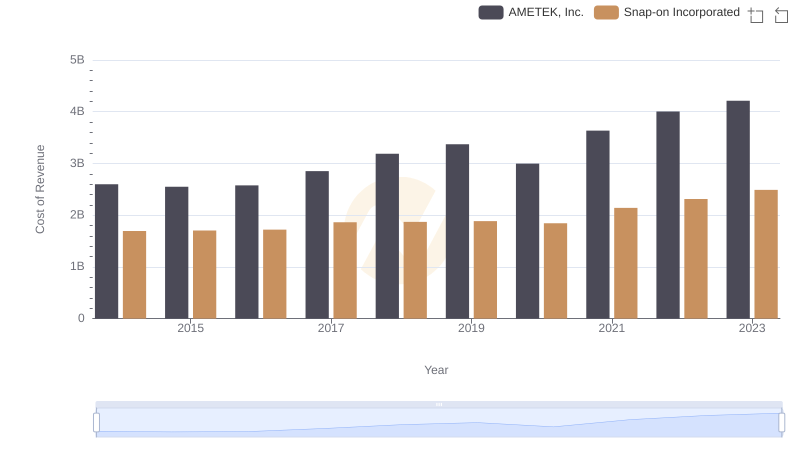
Cost of Revenue Trends: AMETEK, Inc. vs Snap-on Incorporated
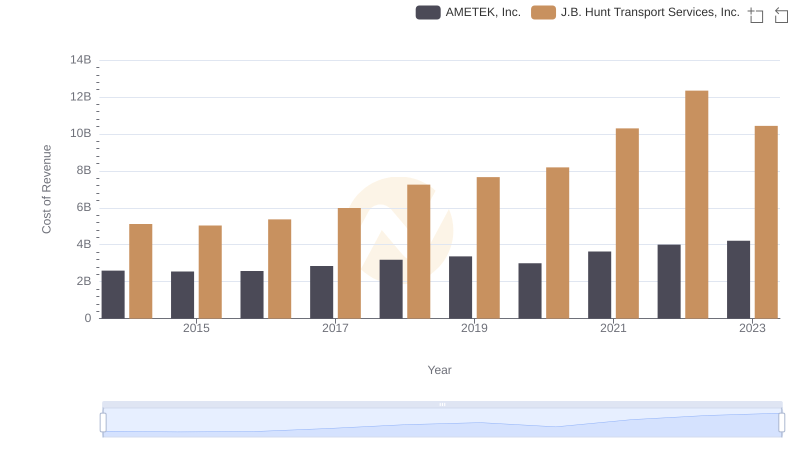
Cost of Revenue Trends: AMETEK, Inc. vs J.B. Hunt Transport Services, Inc.
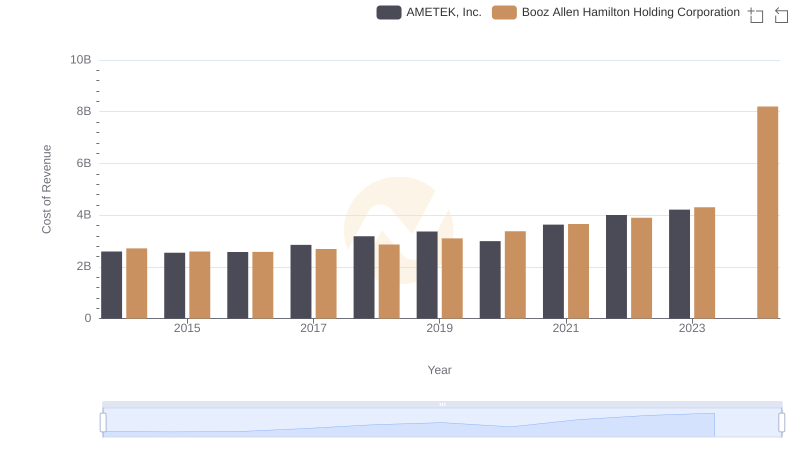
Cost of Revenue Comparison: AMETEK, Inc. vs Booz Allen Hamilton Holding Corporation
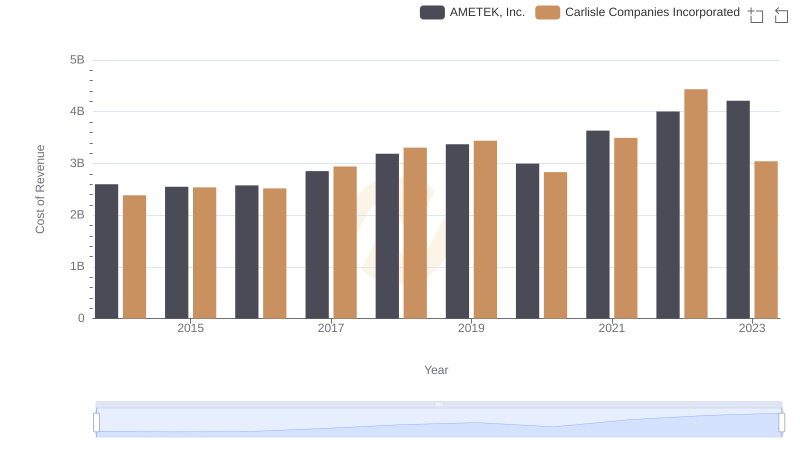
Cost of Revenue Comparison: AMETEK, Inc. vs Carlisle Companies Incorporated
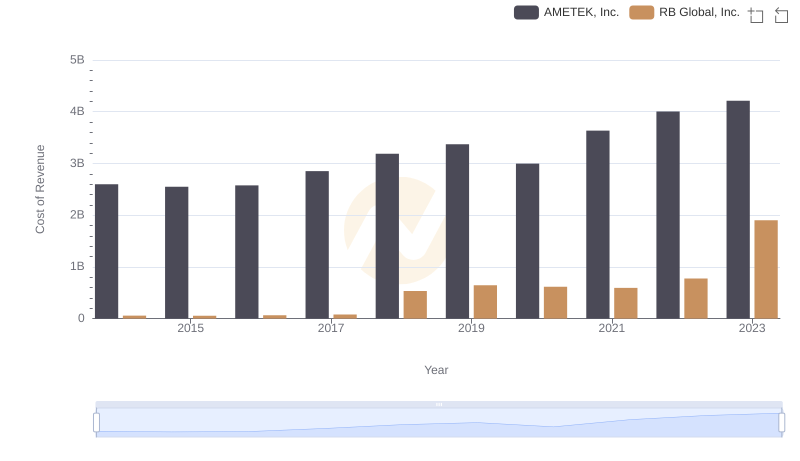
AMETEK, Inc. vs RB Global, Inc.: Efficiency in Cost of Revenue Explored
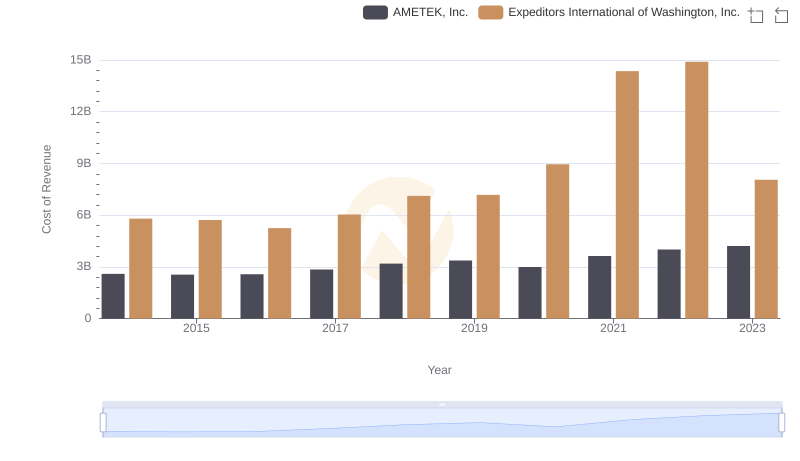
Cost of Revenue Comparison: AMETEK, Inc. vs Expeditors International of Washington, Inc.
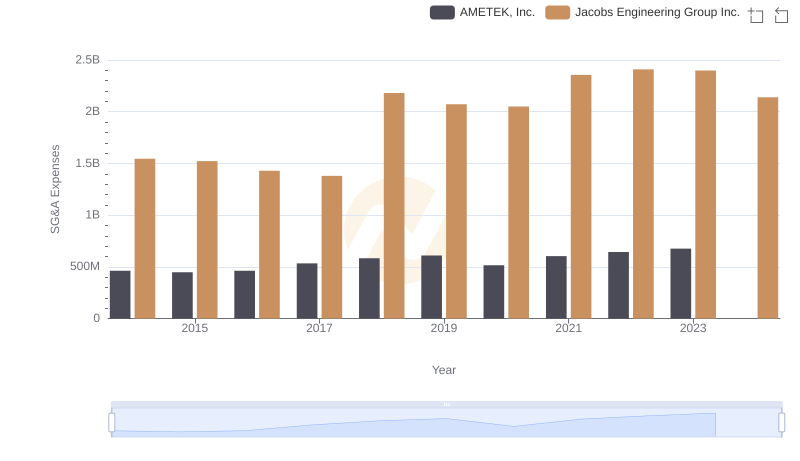
Who Optimizes SG&A Costs Better? AMETEK, Inc. or Jacobs Engineering Group Inc.