| __timestamp | AMETEK, Inc. | RB Global, Inc. |
|---|---|---|
| Wednesday, January 1, 2014 | 1023344000 | 178851000 |
| Thursday, January 1, 2015 | 1093776000 | 211417000 |
| Friday, January 1, 2016 | 1007213000 | 174791291 |
| Sunday, January 1, 2017 | 1068174000 | 168379000 |
| Monday, January 1, 2018 | 1269415000 | 263653000 |
| Tuesday, January 1, 2019 | 1411422000 | 322140110 |
| Wednesday, January 1, 2020 | 1283159000 | 358617000 |
| Friday, January 1, 2021 | 1600782000 | 339928424 |
| Saturday, January 1, 2022 | 1820119000 | 557399151 |
| Sunday, January 1, 2023 | 2025843000 | 975874087 |
| Monday, January 1, 2024 | 1779562000 | 761100000 |
Unveiling the hidden dimensions of data
In the ever-evolving landscape of industrial technology and asset management, AMETEK, Inc. and RB Global, Inc. have showcased remarkable financial trajectories over the past decade. From 2014 to 2023, AMETEK, Inc. has consistently outperformed RB Global, Inc. in terms of EBITDA, reflecting its robust operational efficiency and market adaptability.
AMETEK's Growth: Starting at approximately $1 billion in 2014, AMETEK's EBITDA surged by nearly 98% to reach over $2 billion by 2023. This growth underscores its strategic investments and market expansion.
RB Global's Steady Climb: Despite a more modest beginning, RB Global, Inc. increased its EBITDA by over 445%, from around $179 million in 2014 to nearly $976 million in 2023, highlighting its resilience and strategic positioning in the global market.
This comparative analysis not only highlights the financial prowess of these industry giants but also offers a glimpse into their strategic directions and market dynamics.
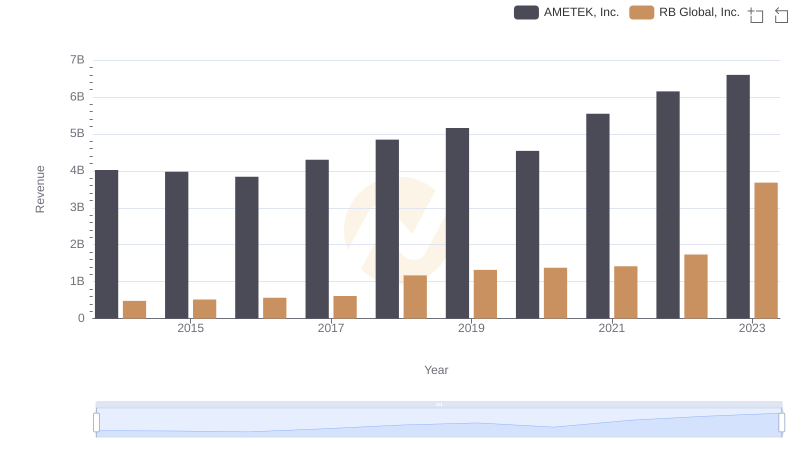
AMETEK, Inc. and RB Global, Inc.: A Comprehensive Revenue Analysis
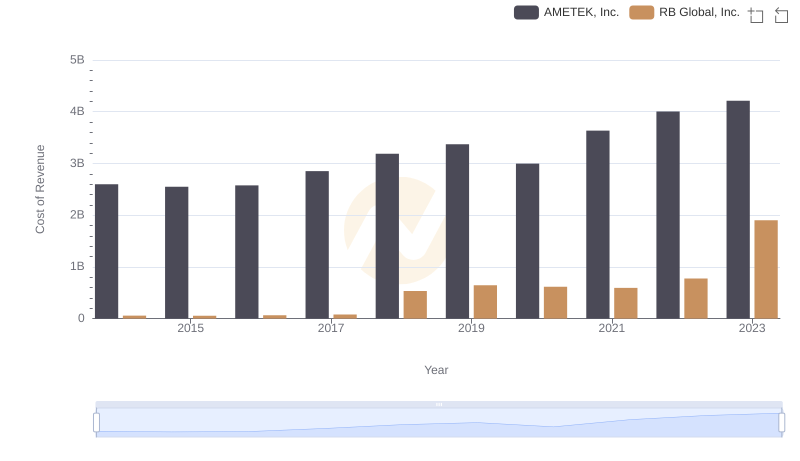
AMETEK, Inc. vs RB Global, Inc.: Efficiency in Cost of Revenue Explored
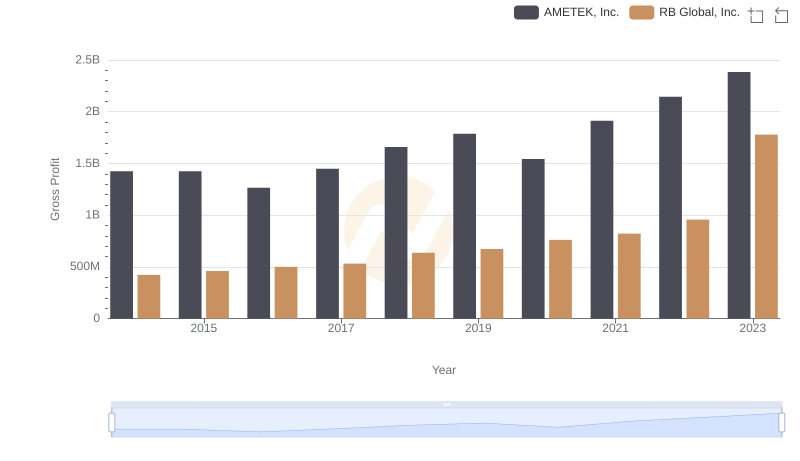
Who Generates Higher Gross Profit? AMETEK, Inc. or RB Global, Inc.
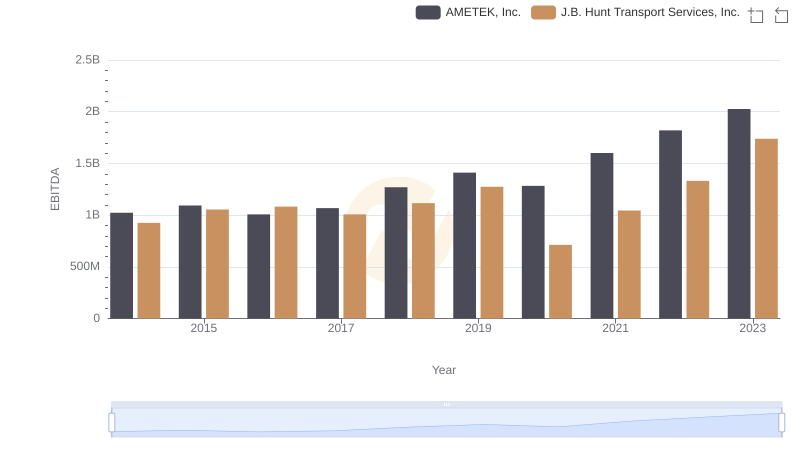
AMETEK, Inc. and J.B. Hunt Transport Services, Inc.: A Detailed Examination of EBITDA Performance
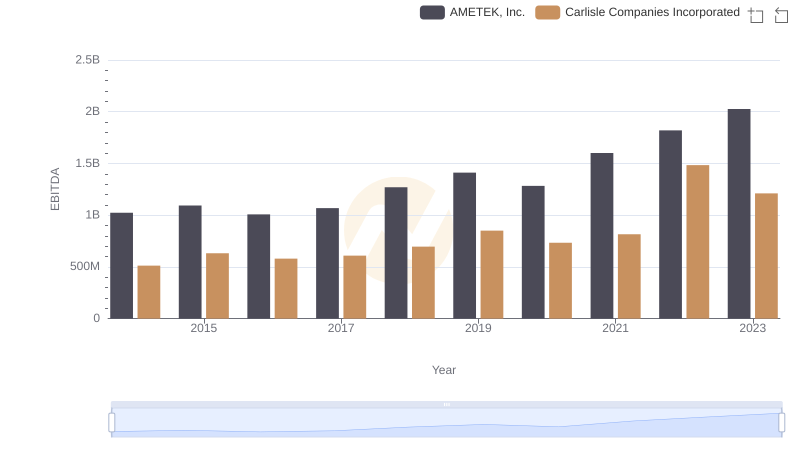
AMETEK, Inc. and Carlisle Companies Incorporated: A Detailed Examination of EBITDA Performance
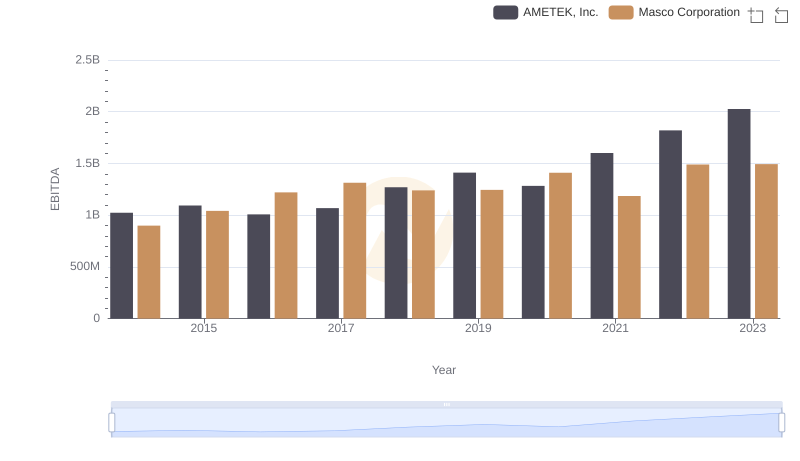
EBITDA Metrics Evaluated: AMETEK, Inc. vs Masco Corporation
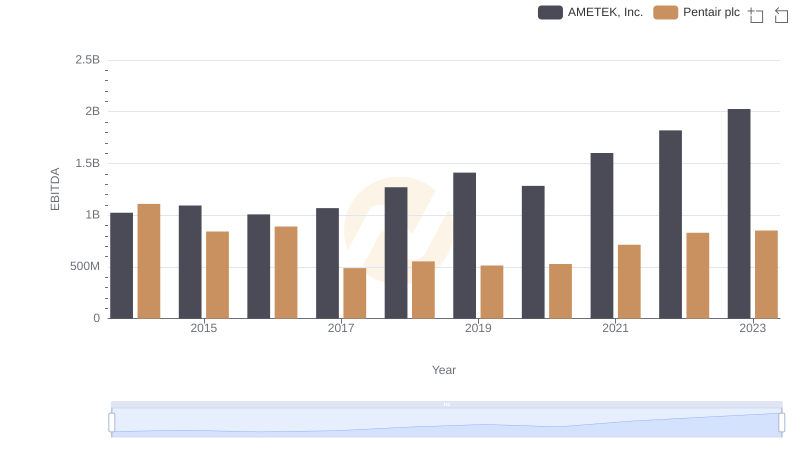
A Professional Review of EBITDA: AMETEK, Inc. Compared to Pentair plc
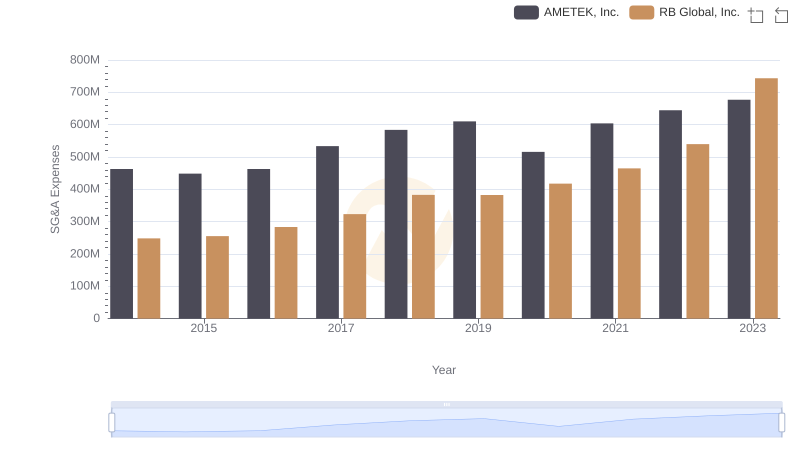
AMETEK, Inc. and RB Global, Inc.: SG&A Spending Patterns Compared
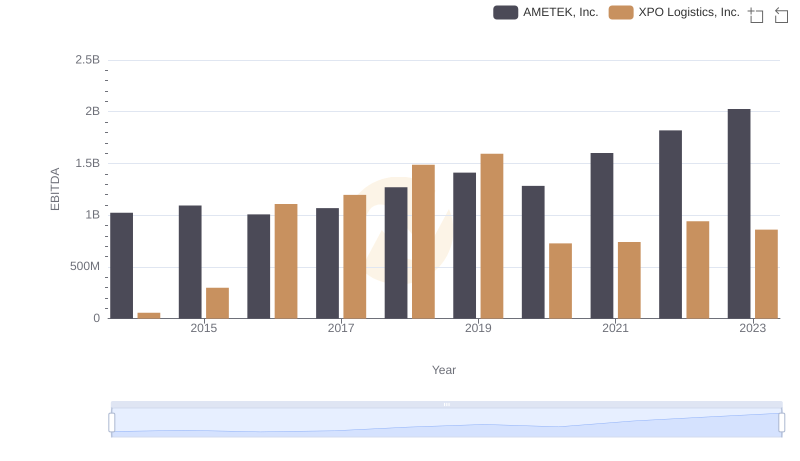
AMETEK, Inc. and XPO Logistics, Inc.: A Detailed Examination of EBITDA Performance
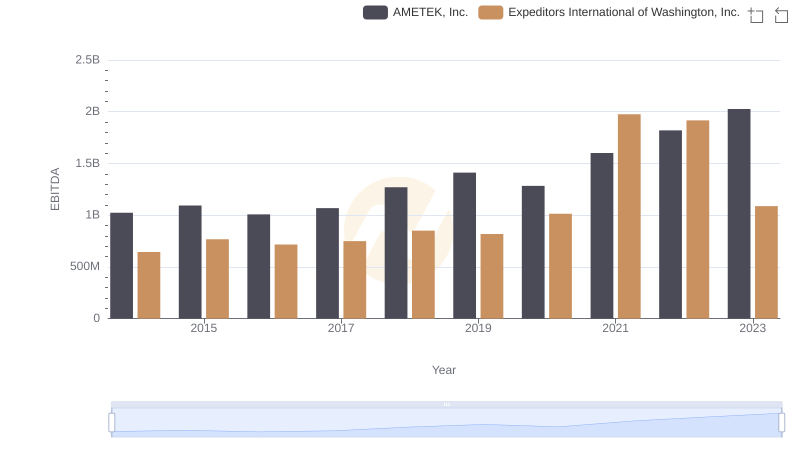
AMETEK, Inc. and Expeditors International of Washington, Inc.: A Detailed Examination of EBITDA Performance
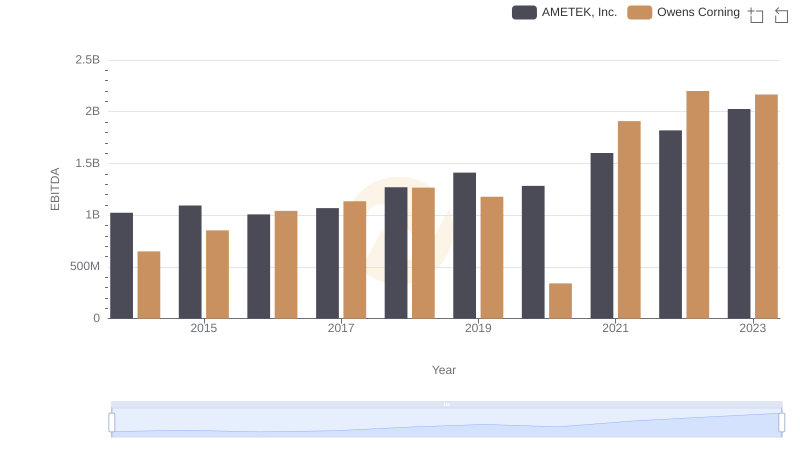
EBITDA Performance Review: AMETEK, Inc. vs Owens Corning