| __timestamp | AMETEK, Inc. | Carlisle Companies Incorporated |
|---|---|---|
| Wednesday, January 1, 2014 | 2597017000 | 2384500000 |
| Thursday, January 1, 2015 | 2549280000 | 2536500000 |
| Friday, January 1, 2016 | 2575220000 | 2518100000 |
| Sunday, January 1, 2017 | 2851431000 | 2941900000 |
| Monday, January 1, 2018 | 3186310000 | 3304800000 |
| Tuesday, January 1, 2019 | 3370897000 | 3439900000 |
| Wednesday, January 1, 2020 | 2996515000 | 2832500000 |
| Friday, January 1, 2021 | 3633900000 | 3495600000 |
| Saturday, January 1, 2022 | 4005261000 | 4434500000 |
| Sunday, January 1, 2023 | 4212484999 | 3042900000 |
| Monday, January 1, 2024 | 0 | 3115900000 |
In pursuit of knowledge
In the ever-evolving landscape of industrial manufacturing, AMETEK, Inc. and Carlisle Companies Incorporated have been pivotal players. Over the past decade, these giants have showcased intriguing trends in their cost of revenue. From 2014 to 2023, AMETEK's cost of revenue surged by approximately 62%, peaking in 2023. Meanwhile, Carlisle experienced a more modest increase of around 28%, with a notable dip in 2023.
These trends reflect strategic shifts and market dynamics, offering a window into the operational efficiencies and challenges faced by these industry leaders.
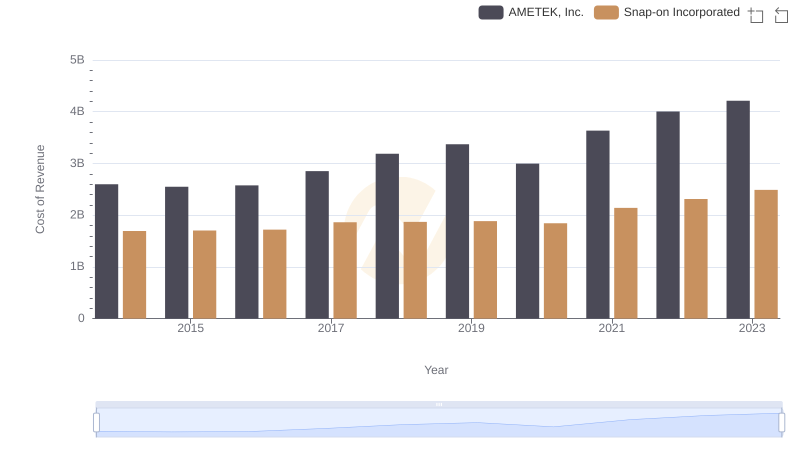
Cost of Revenue Trends: AMETEK, Inc. vs Snap-on Incorporated
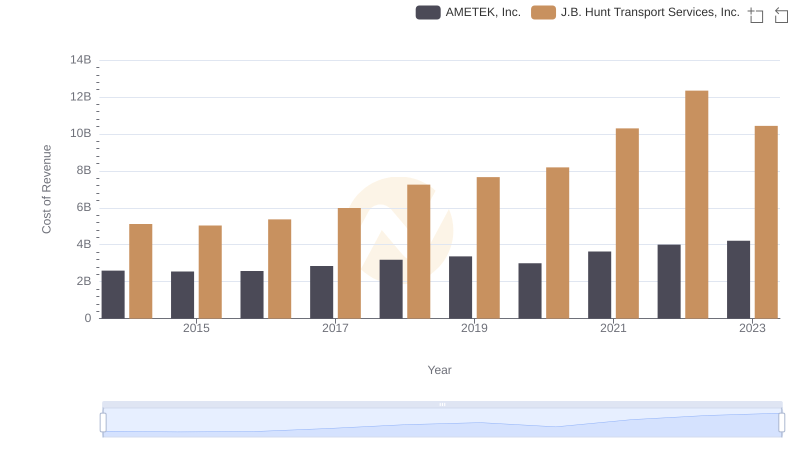
Cost of Revenue Trends: AMETEK, Inc. vs J.B. Hunt Transport Services, Inc.
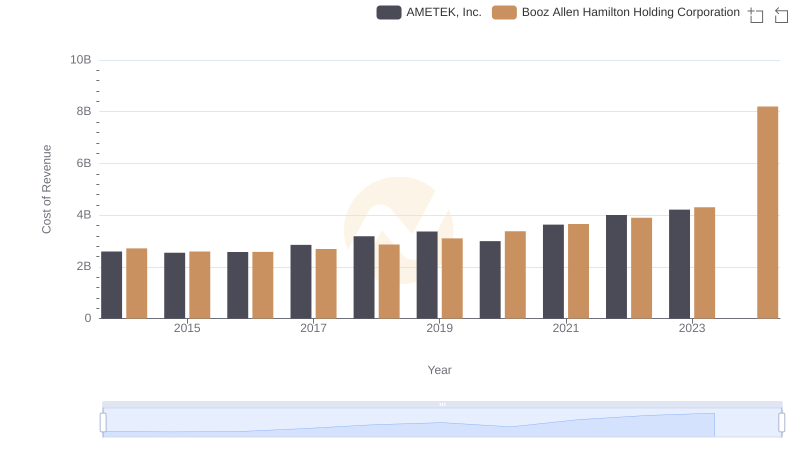
Cost of Revenue Comparison: AMETEK, Inc. vs Booz Allen Hamilton Holding Corporation
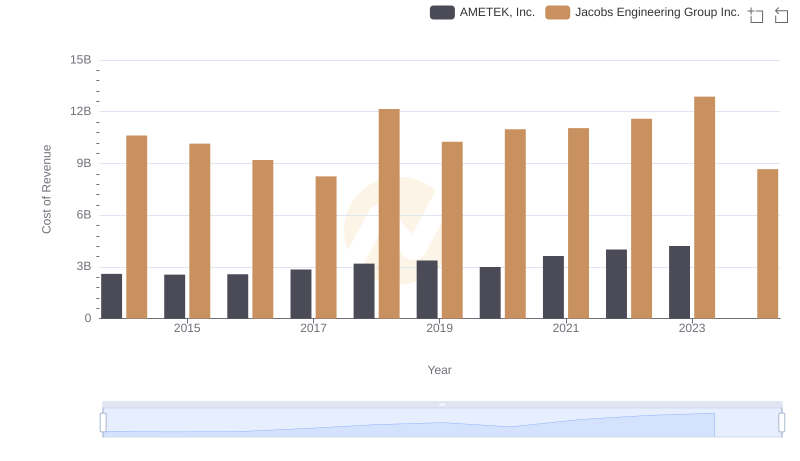
AMETEK, Inc. vs Jacobs Engineering Group Inc.: Efficiency in Cost of Revenue Explored
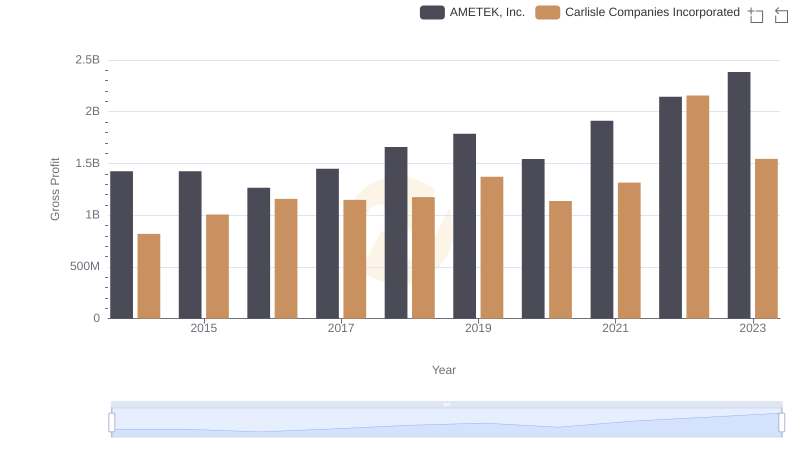
Gross Profit Comparison: AMETEK, Inc. and Carlisle Companies Incorporated Trends
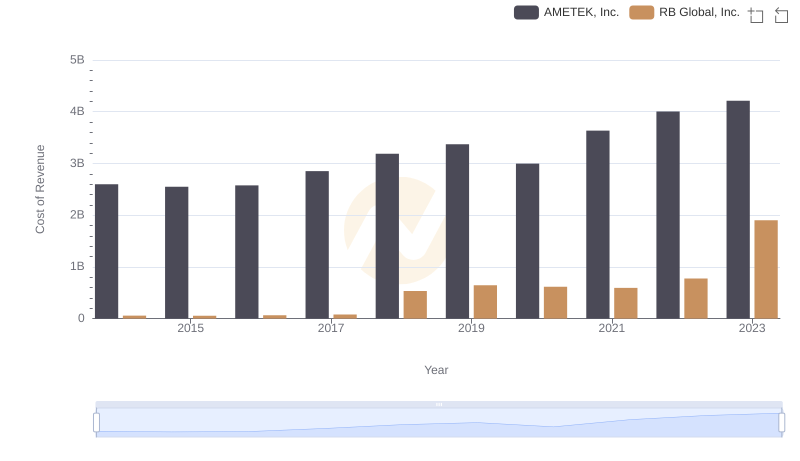
AMETEK, Inc. vs RB Global, Inc.: Efficiency in Cost of Revenue Explored
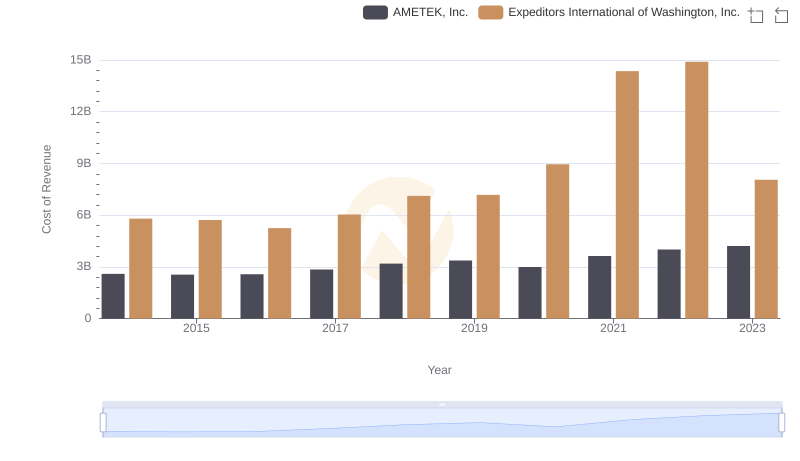
Cost of Revenue Comparison: AMETEK, Inc. vs Expeditors International of Washington, Inc.
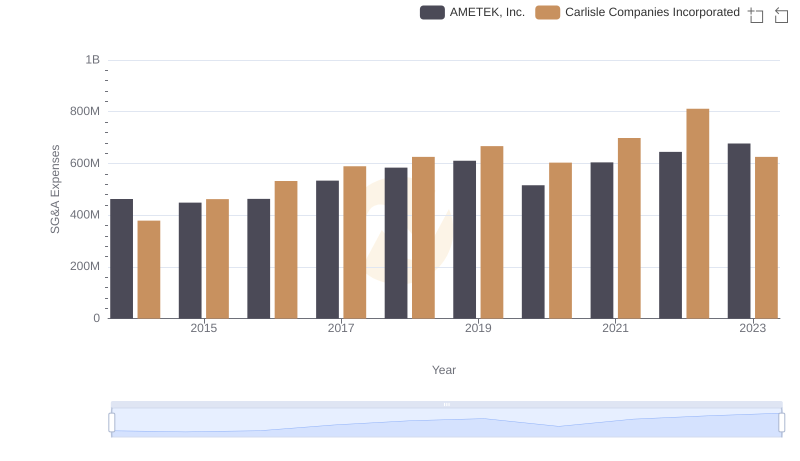
AMETEK, Inc. and Carlisle Companies Incorporated: SG&A Spending Patterns Compared
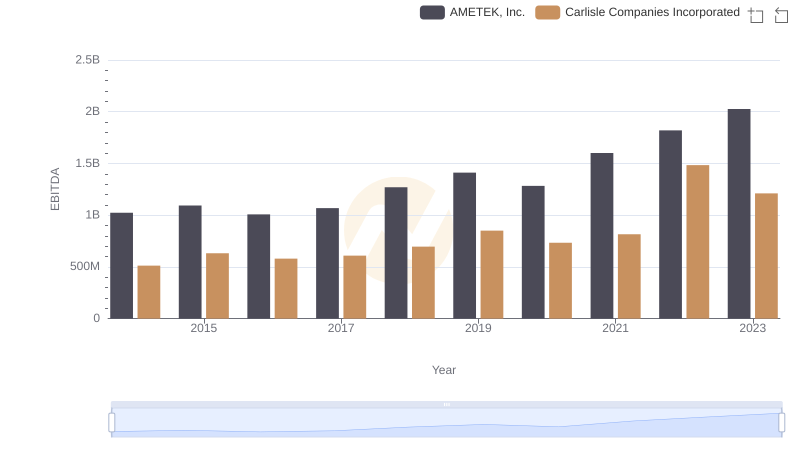
AMETEK, Inc. and Carlisle Companies Incorporated: A Detailed Examination of EBITDA Performance