| __timestamp | AMETEK, Inc. | RB Global, Inc. |
|---|---|---|
| Wednesday, January 1, 2014 | 1424947000 | 423213000 |
| Thursday, January 1, 2015 | 1425015000 | 459849000 |
| Friday, January 1, 2016 | 1264867000 | 500333000 |
| Sunday, January 1, 2017 | 1448739000 | 531504000 |
| Monday, January 1, 2018 | 1659562000 | 636629000 |
| Tuesday, January 1, 2019 | 1787660000 | 672825000 |
| Wednesday, January 1, 2020 | 1543514000 | 761671000 |
| Friday, January 1, 2021 | 1912614000 | 822188000 |
| Saturday, January 1, 2022 | 2145269000 | 957107000 |
| Sunday, January 1, 2023 | 2384465001 | 1778400000 |
| Monday, January 1, 2024 | 6941180000 | 4284200000 |
Cracking the code
In the competitive landscape of industrial manufacturing, AMETEK, Inc. and RB Global, Inc. have emerged as formidable players. Over the past decade, AMETEK has consistently outperformed RB Global in terms of gross profit. From 2014 to 2023, AMETEK's gross profit surged by approximately 67%, reaching a peak in 2023. In contrast, RB Global's gross profit, while showing a commendable growth of over 320% during the same period, still trails behind AMETEK.
The year 2023 marked a significant milestone, with AMETEK generating a gross profit nearly 34% higher than RB Global. This trend underscores AMETEK's robust market strategy and operational efficiency. As the industrial sector continues to evolve, these insights provide a glimpse into the financial health and strategic direction of these industry leaders.
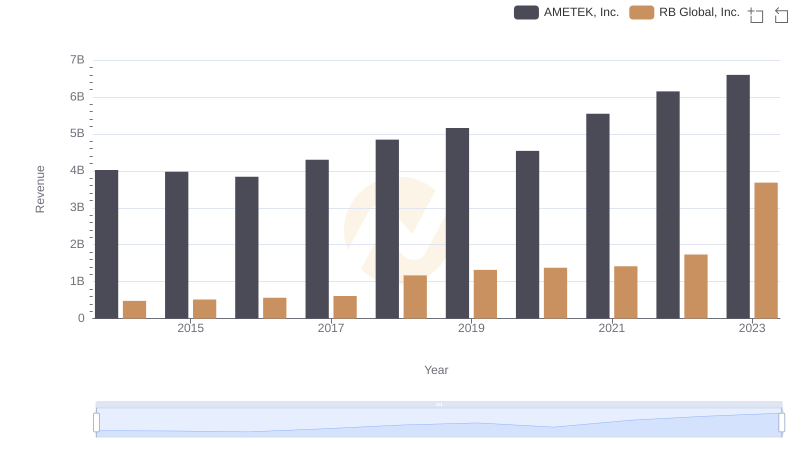
AMETEK, Inc. and RB Global, Inc.: A Comprehensive Revenue Analysis
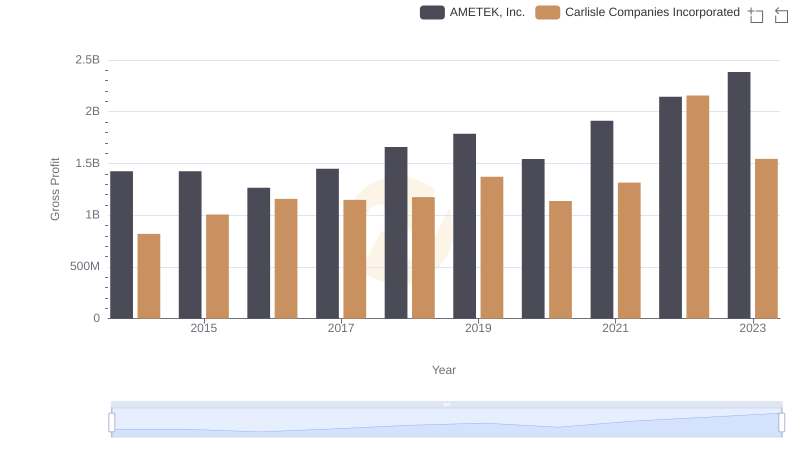
Gross Profit Comparison: AMETEK, Inc. and Carlisle Companies Incorporated Trends
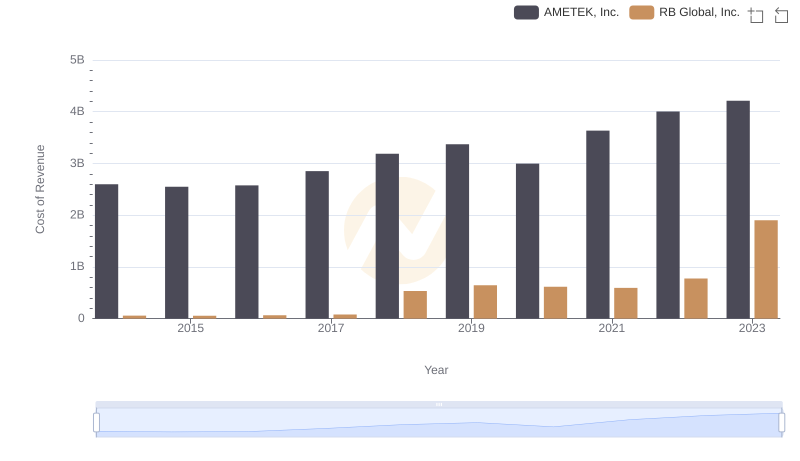
AMETEK, Inc. vs RB Global, Inc.: Efficiency in Cost of Revenue Explored
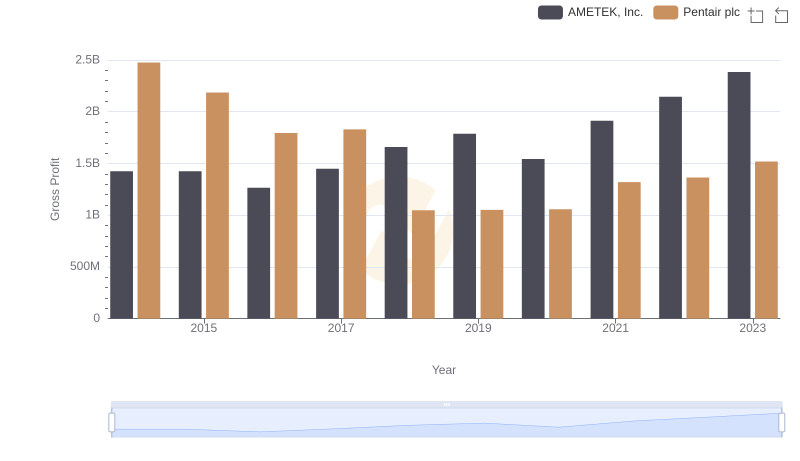
Gross Profit Analysis: Comparing AMETEK, Inc. and Pentair plc
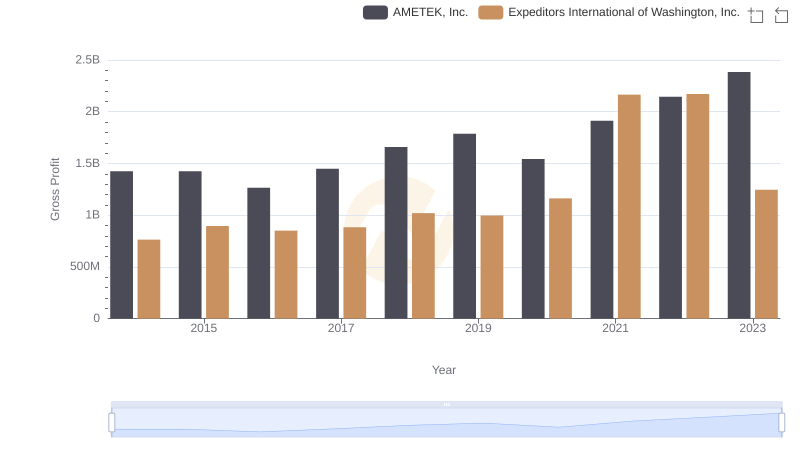
AMETEK, Inc. vs Expeditors International of Washington, Inc.: A Gross Profit Performance Breakdown
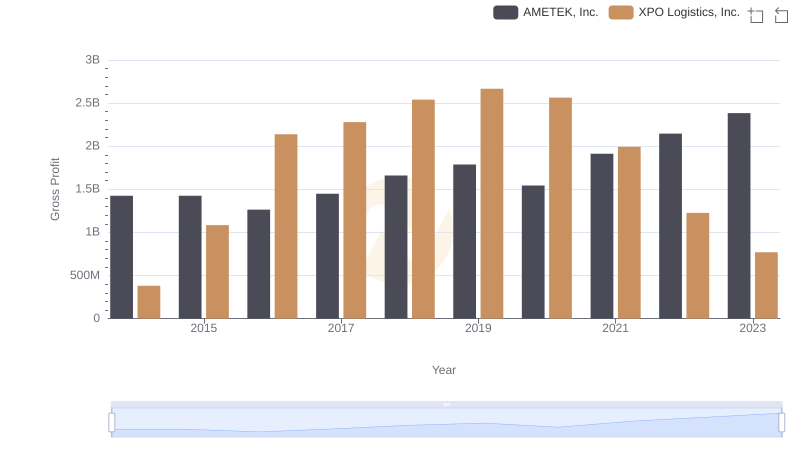
Gross Profit Comparison: AMETEK, Inc. and XPO Logistics, Inc. Trends
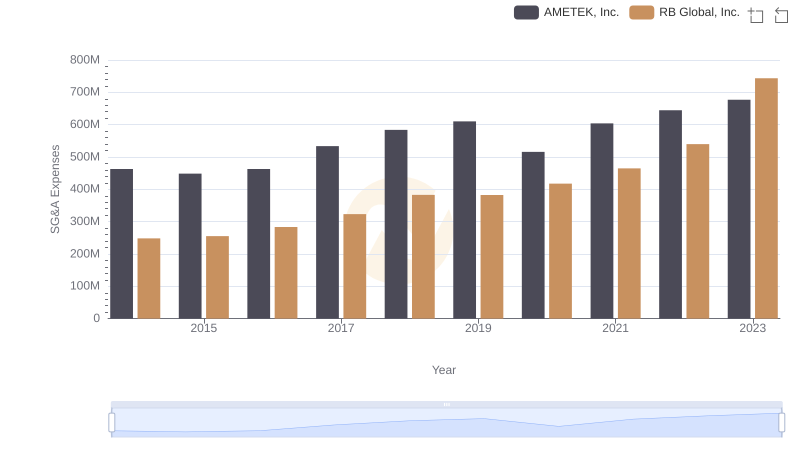
AMETEK, Inc. and RB Global, Inc.: SG&A Spending Patterns Compared
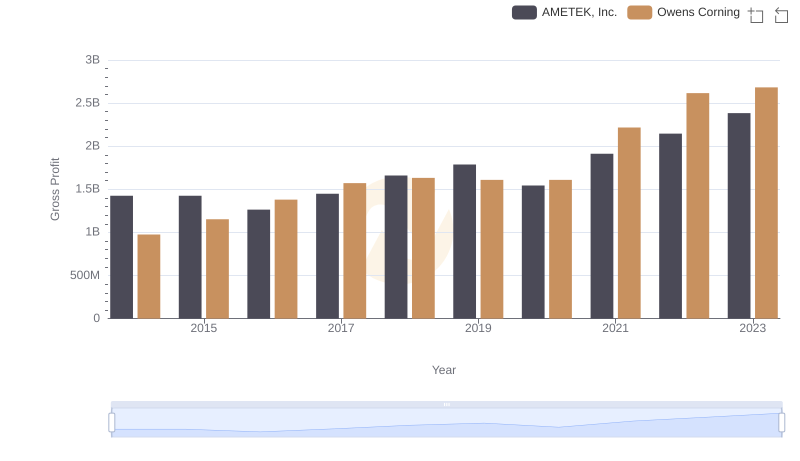
Who Generates Higher Gross Profit? AMETEK, Inc. or Owens Corning
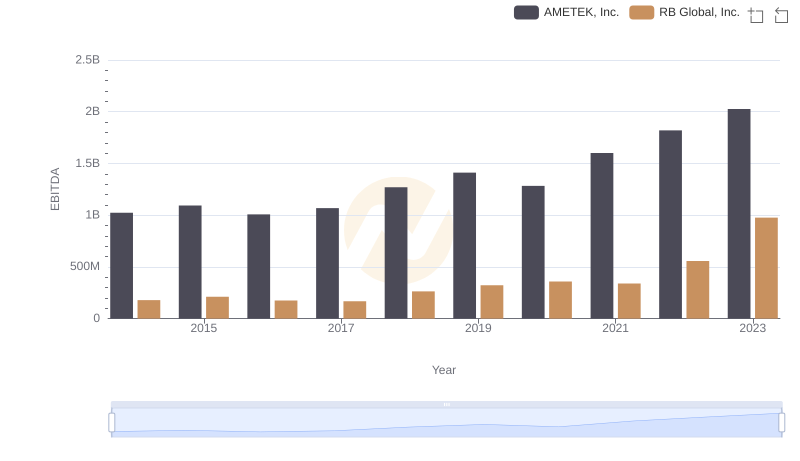
A Professional Review of EBITDA: AMETEK, Inc. Compared to RB Global, Inc.