| __timestamp | AMETEK, Inc. | L3Harris Technologies, Inc. |
|---|---|---|
| Wednesday, January 1, 2014 | 462637000 | 883000000 |
| Thursday, January 1, 2015 | 448592000 | 1105000000 |
| Friday, January 1, 2016 | 462970000 | 1150000000 |
| Sunday, January 1, 2017 | 533645000 | 1182000000 |
| Monday, January 1, 2018 | 584022000 | 1242000000 |
| Tuesday, January 1, 2019 | 610280000 | 2156000000 |
| Wednesday, January 1, 2020 | 515630000 | 3315000000 |
| Friday, January 1, 2021 | 603944000 | 3280000000 |
| Saturday, January 1, 2022 | 644577000 | 2998000000 |
| Sunday, January 1, 2023 | 677006000 | 1921000000 |
| Monday, January 1, 2024 | 696905000 | 3568000000 |
Unleashing the power of data
In the ever-evolving landscape of corporate finance, understanding operational costs is crucial. This analysis delves into the Selling, General, and Administrative (SG&A) expenses of two industry giants: AMETEK, Inc. and L3Harris Technologies, Inc., from 2014 to 2023. Over this period, L3Harris consistently outspent AMETEK, with SG&A expenses peaking in 2020 at over 3.3 billion dollars, a staggering 540% increase compared to AMETEK's highest expenditure in 2023. Interestingly, AMETEK's SG&A expenses grew steadily, reaching their zenith in 2023, marking a 46% increase from 2014. This trend highlights AMETEK's strategic cost management, contrasting with L3Harris's fluctuating expenses, which saw a significant drop of 42% from 2020 to 2023. Such insights are invaluable for investors and analysts seeking to understand the financial strategies of these corporations.
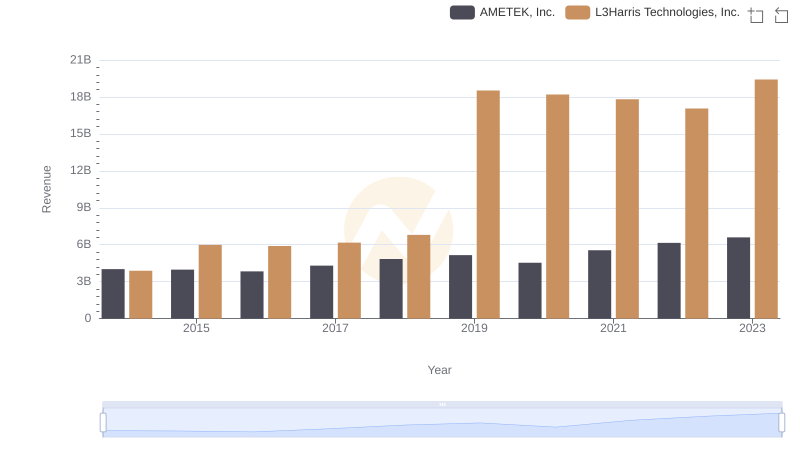
Revenue Showdown: AMETEK, Inc. vs L3Harris Technologies, Inc.
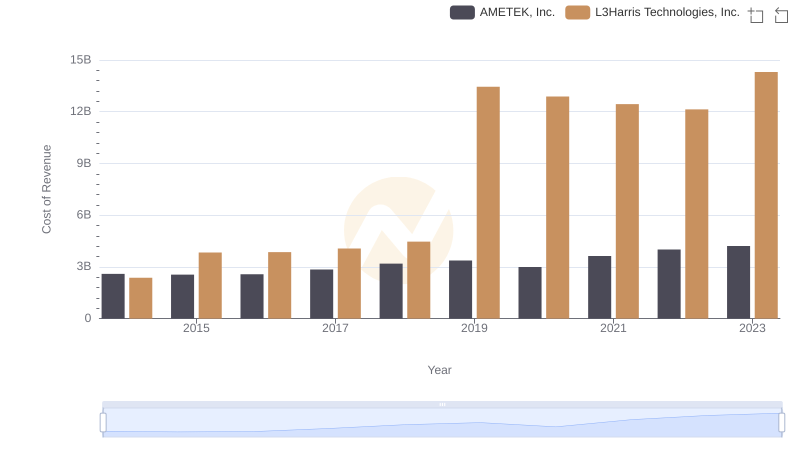
Cost Insights: Breaking Down AMETEK, Inc. and L3Harris Technologies, Inc.'s Expenses
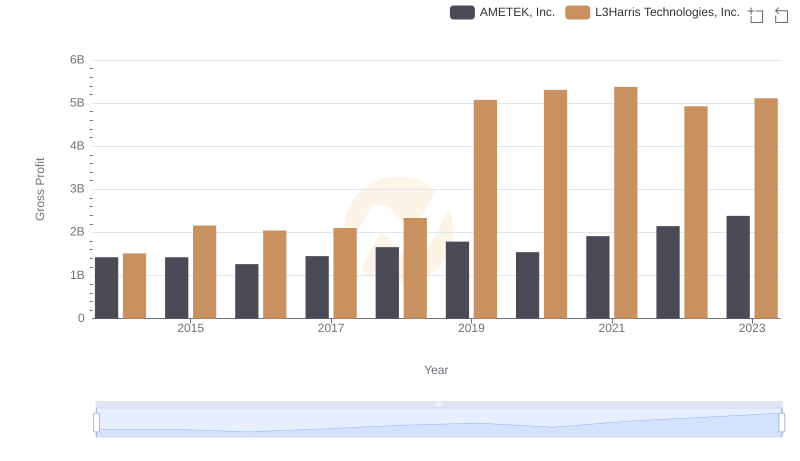
AMETEK, Inc. vs L3Harris Technologies, Inc.: A Gross Profit Performance Breakdown
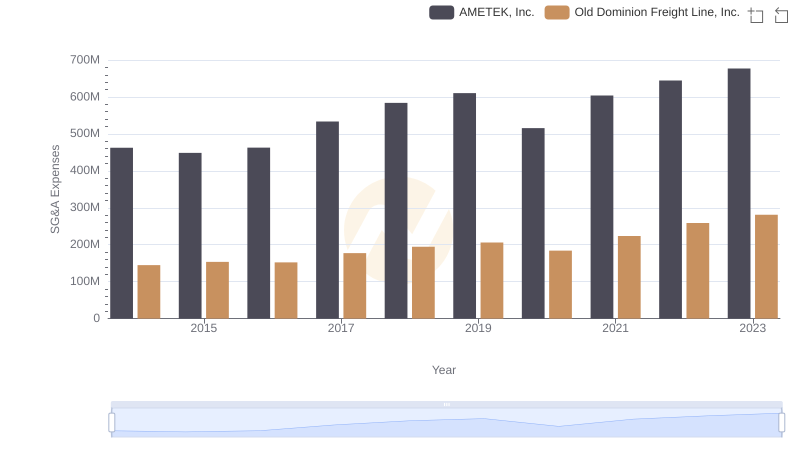
Who Optimizes SG&A Costs Better? AMETEK, Inc. or Old Dominion Freight Line, Inc.
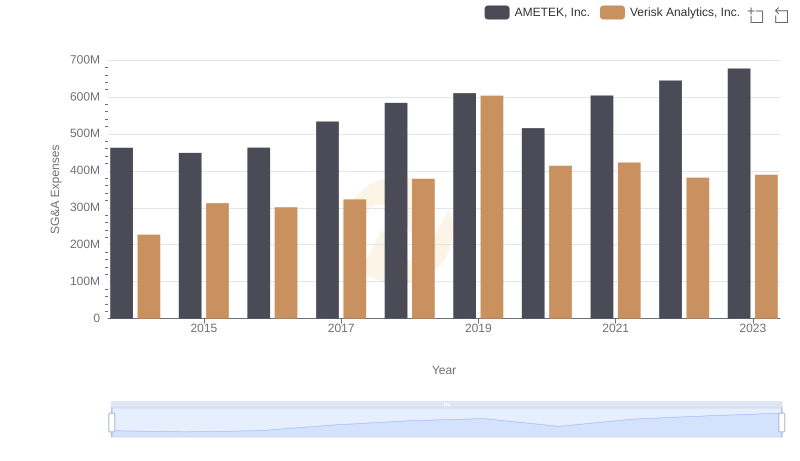
Comparing SG&A Expenses: AMETEK, Inc. vs Verisk Analytics, Inc. Trends and Insights
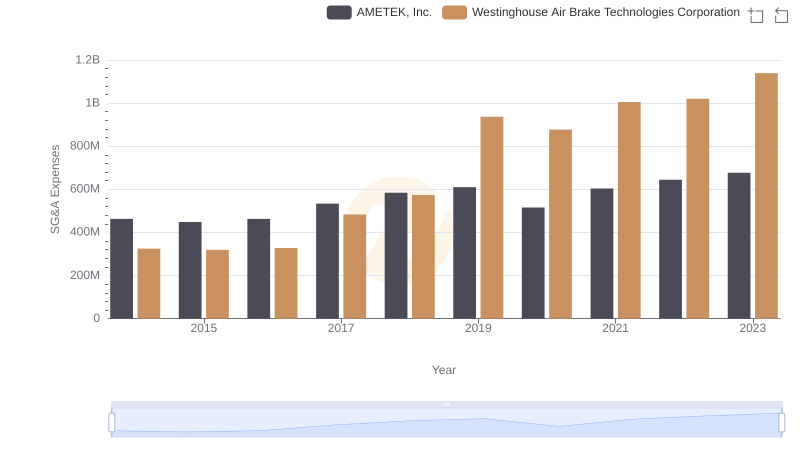
Selling, General, and Administrative Costs: AMETEK, Inc. vs Westinghouse Air Brake Technologies Corporation
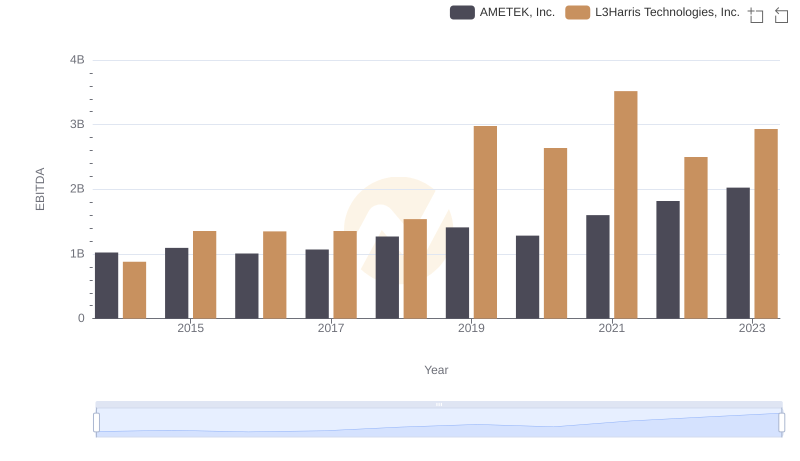
Professional EBITDA Benchmarking: AMETEK, Inc. vs L3Harris Technologies, Inc.
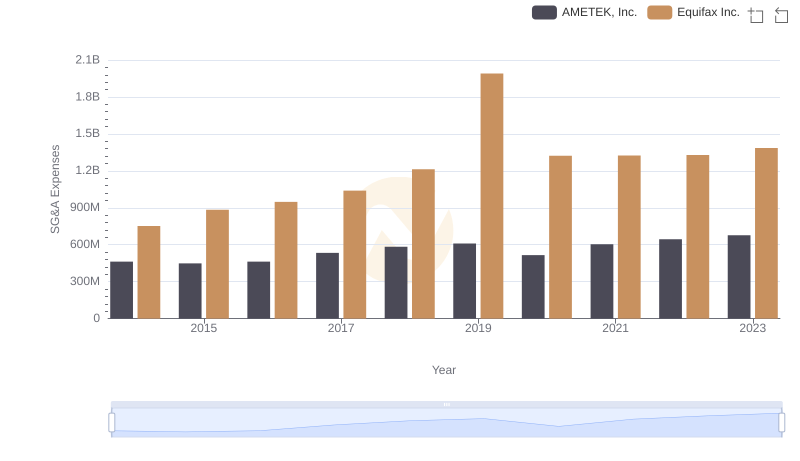
Cost Management Insights: SG&A Expenses for AMETEK, Inc. and Equifax Inc.
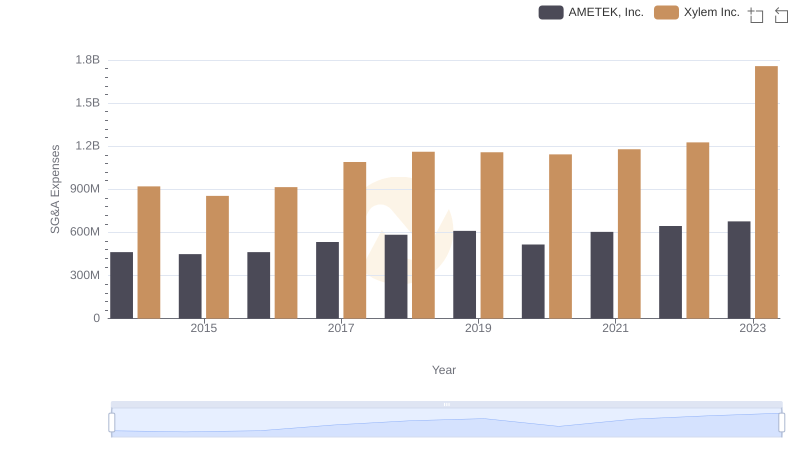
Comparing SG&A Expenses: AMETEK, Inc. vs Xylem Inc. Trends and Insights