| __timestamp | AMETEK, Inc. | L3Harris Technologies, Inc. |
|---|---|---|
| Wednesday, January 1, 2014 | 1023344000 | 879000000 |
| Thursday, January 1, 2015 | 1093776000 | 1356000000 |
| Friday, January 1, 2016 | 1007213000 | 1350000000 |
| Sunday, January 1, 2017 | 1068174000 | 1356000000 |
| Monday, January 1, 2018 | 1269415000 | 1538000000 |
| Tuesday, January 1, 2019 | 1411422000 | 2980000000 |
| Wednesday, January 1, 2020 | 1283159000 | 2639000000 |
| Friday, January 1, 2021 | 1600782000 | 3518000000 |
| Saturday, January 1, 2022 | 1820119000 | 2499000000 |
| Sunday, January 1, 2023 | 2025843000 | 2932000000 |
| Monday, January 1, 2024 | 1779562000 | 3561000000 |
Unveiling the hidden dimensions of data
In the competitive landscape of the industrial sector, AMETEK, Inc. and L3Harris Technologies, Inc. have demonstrated significant financial performance over the past decade. From 2014 to 2023, AMETEK's EBITDA grew by approximately 98%, starting from $1.02 billion to $2.03 billion. Meanwhile, L3Harris Technologies showcased a robust 233% increase, rising from $879 million to $2.93 billion. This growth trajectory highlights L3Harris's aggressive expansion and strategic acquisitions, particularly evident in the 2019 spike, where EBITDA nearly doubled. AMETEK, while maintaining steady growth, saw its most substantial increase in 2023, reflecting its resilience and adaptability in a fluctuating market. These trends underscore the dynamic nature of the industrial sector, where strategic decisions and market conditions play pivotal roles in shaping financial outcomes. As we look to the future, both companies are well-positioned to leverage their strengths and continue their upward momentum.
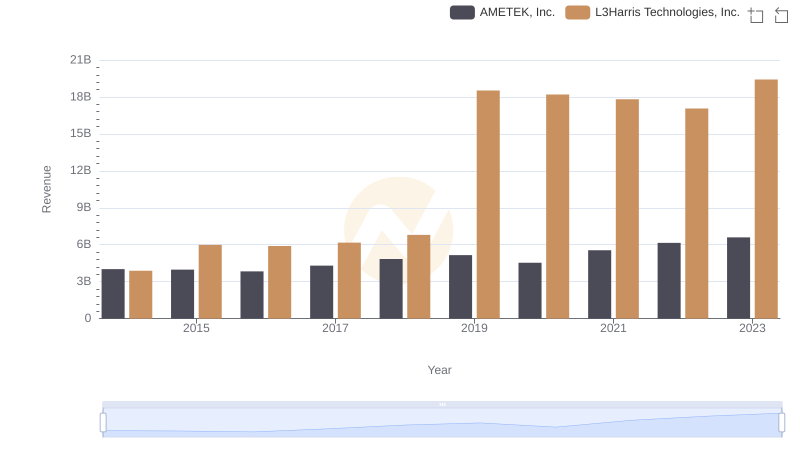
Revenue Showdown: AMETEK, Inc. vs L3Harris Technologies, Inc.
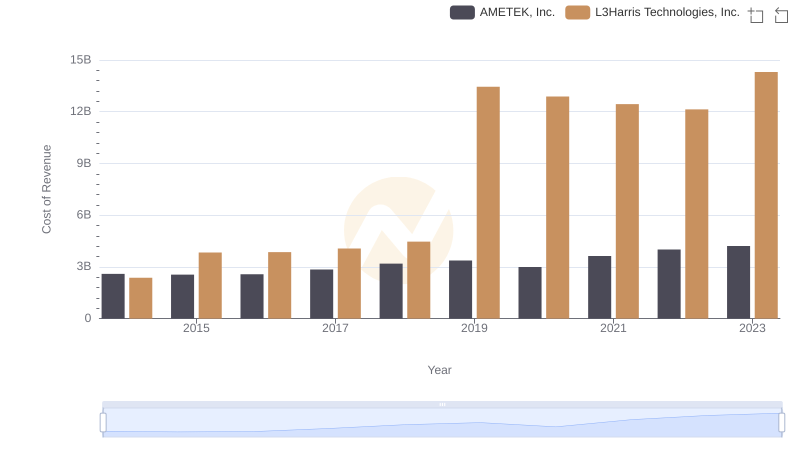
Cost Insights: Breaking Down AMETEK, Inc. and L3Harris Technologies, Inc.'s Expenses
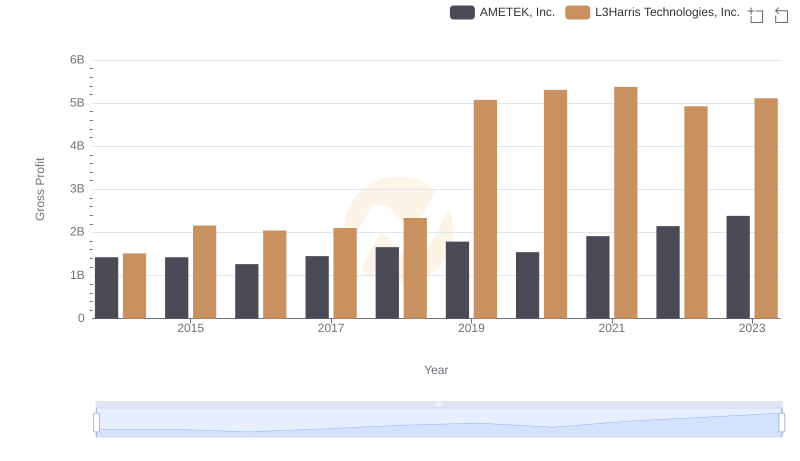
AMETEK, Inc. vs L3Harris Technologies, Inc.: A Gross Profit Performance Breakdown
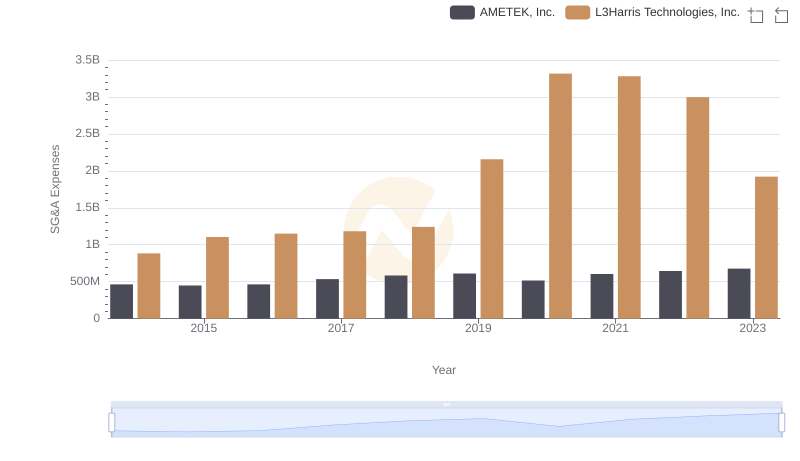
Operational Costs Compared: SG&A Analysis of AMETEK, Inc. and L3Harris Technologies, Inc.
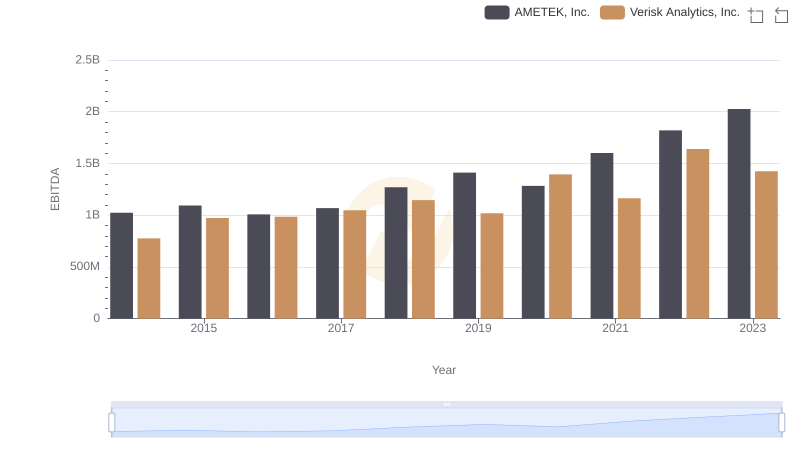
Professional EBITDA Benchmarking: AMETEK, Inc. vs Verisk Analytics, Inc.
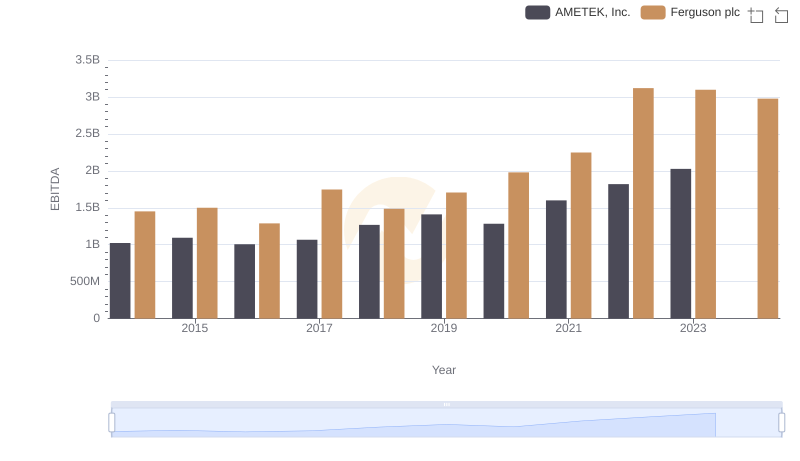
A Side-by-Side Analysis of EBITDA: AMETEK, Inc. and Ferguson plc
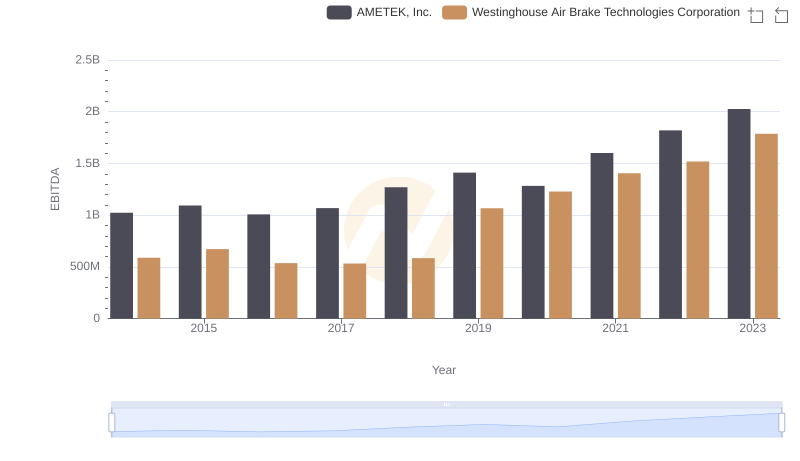
A Professional Review of EBITDA: AMETEK, Inc. Compared to Westinghouse Air Brake Technologies Corporation
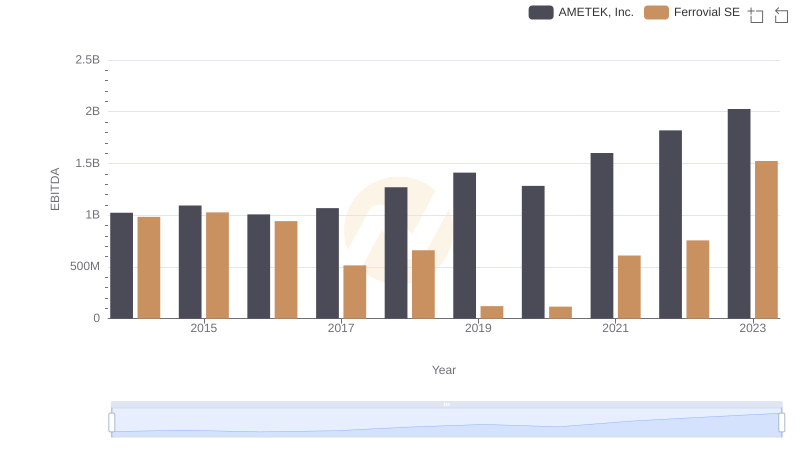
A Side-by-Side Analysis of EBITDA: AMETEK, Inc. and Ferrovial SE
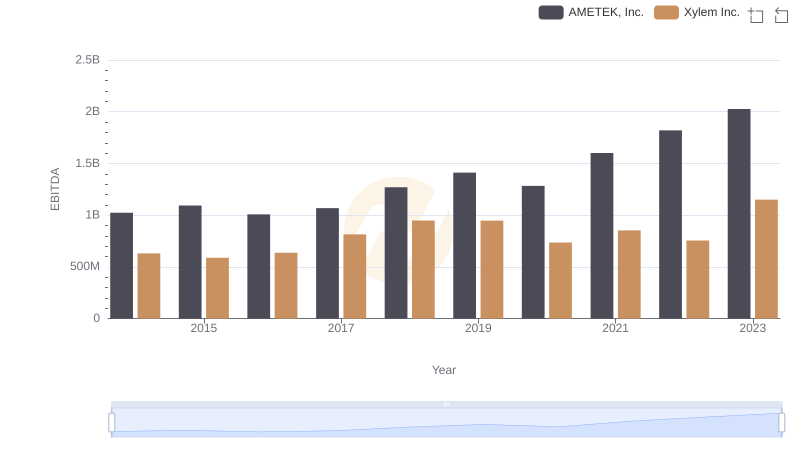
Professional EBITDA Benchmarking: AMETEK, Inc. vs Xylem Inc.
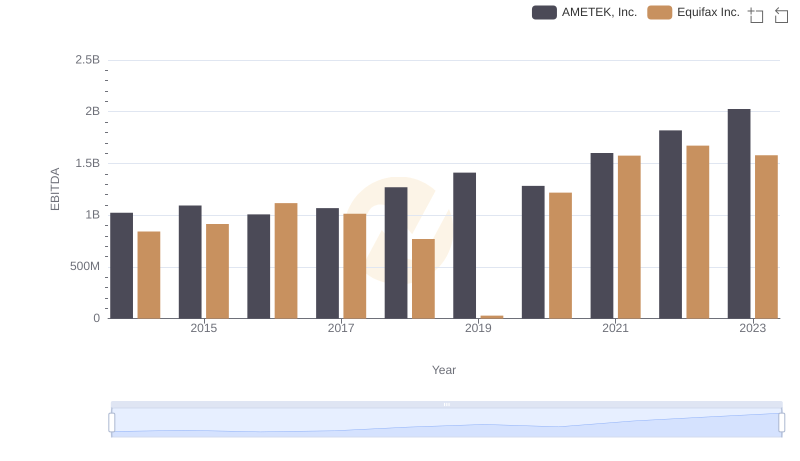
Comparative EBITDA Analysis: AMETEK, Inc. vs Equifax Inc.
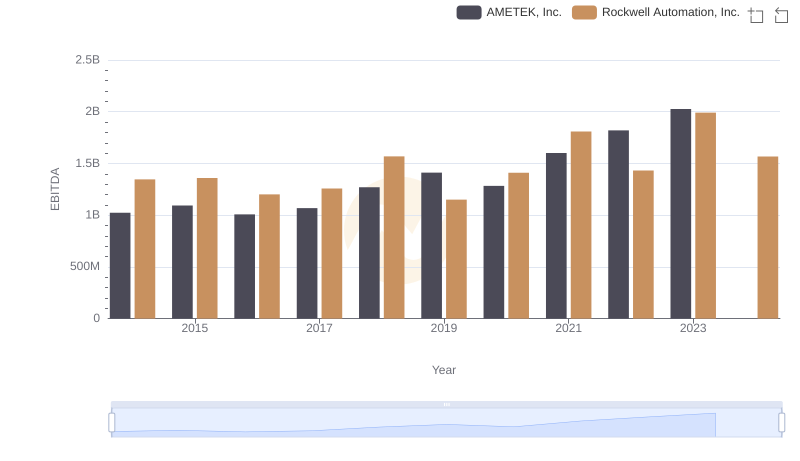
Professional EBITDA Benchmarking: AMETEK, Inc. vs Rockwell Automation, Inc.