| __timestamp | AMETEK, Inc. | L3Harris Technologies, Inc. |
|---|---|---|
| Wednesday, January 1, 2014 | 2597017000 | 2370000000 |
| Thursday, January 1, 2015 | 2549280000 | 3832000000 |
| Friday, January 1, 2016 | 2575220000 | 3854000000 |
| Sunday, January 1, 2017 | 2851431000 | 4066000000 |
| Monday, January 1, 2018 | 3186310000 | 4467000000 |
| Tuesday, January 1, 2019 | 3370897000 | 13452000000 |
| Wednesday, January 1, 2020 | 2996515000 | 12886000000 |
| Friday, January 1, 2021 | 3633900000 | 12438000000 |
| Saturday, January 1, 2022 | 4005261000 | 12135000000 |
| Sunday, January 1, 2023 | 4212484999 | 14306000000 |
| Monday, January 1, 2024 | 0 | 15801000000 |
Unlocking the unknown
In the ever-evolving landscape of industrial technology and defense, understanding cost structures is crucial. AMETEK, Inc. and L3Harris Technologies, Inc. have been pivotal players in their respective fields. From 2014 to 2023, AMETEK's cost of revenue has seen a steady increase, growing by approximately 62% over the decade. In contrast, L3Harris Technologies experienced a more volatile trajectory, with a significant spike in 2019, marking a 260% increase from 2014. This surge aligns with L3Harris's strategic mergers and acquisitions, reflecting its aggressive expansion strategy. By 2023, L3Harris's cost of revenue was more than three times that of AMETEK, highlighting the scale and scope of its operations. This comparative analysis underscores the diverse financial strategies and market positions of these industry giants, offering valuable insights for investors and stakeholders.
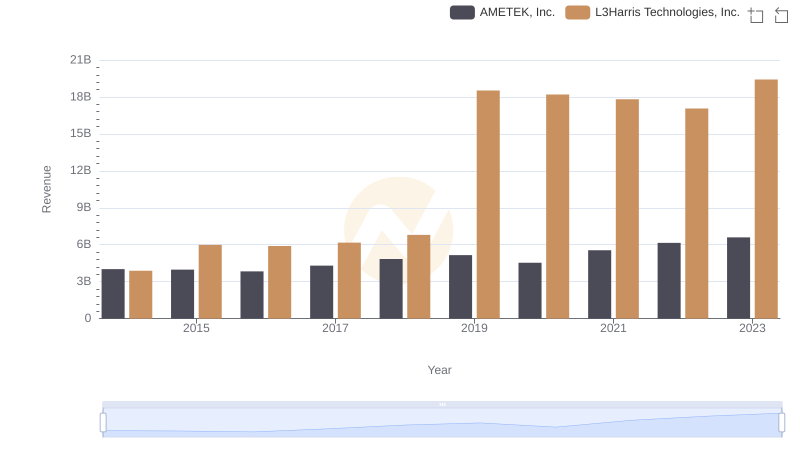
Revenue Showdown: AMETEK, Inc. vs L3Harris Technologies, Inc.
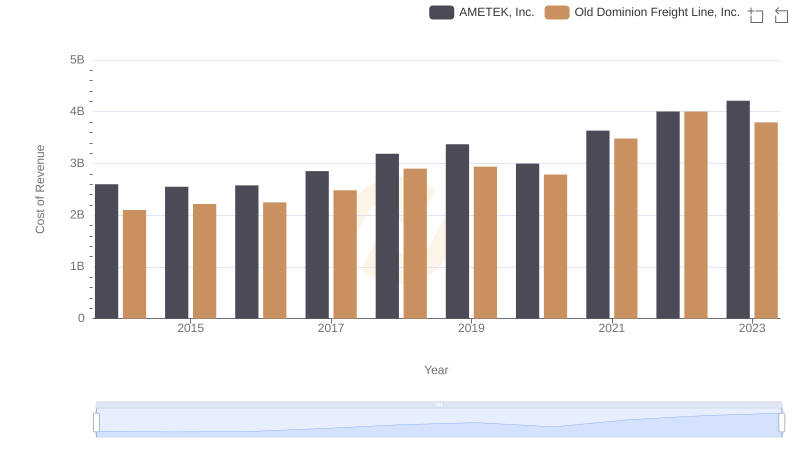
Cost of Revenue: Key Insights for AMETEK, Inc. and Old Dominion Freight Line, Inc.
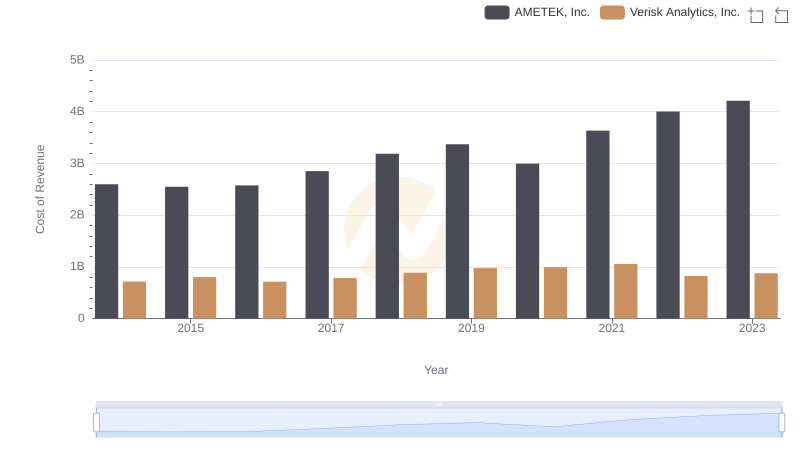
Cost of Revenue Comparison: AMETEK, Inc. vs Verisk Analytics, Inc.
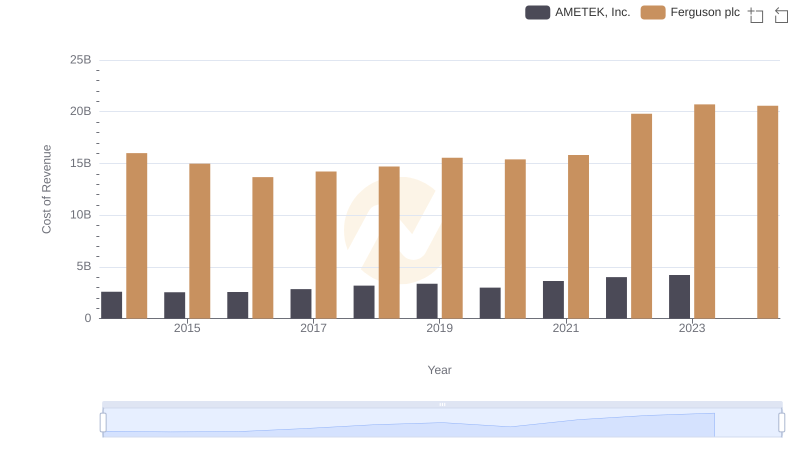
AMETEK, Inc. vs Ferguson plc: Efficiency in Cost of Revenue Explored
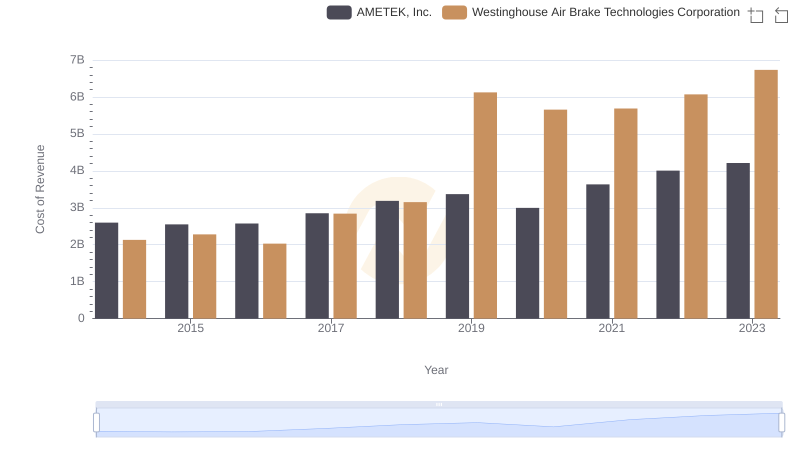
Cost Insights: Breaking Down AMETEK, Inc. and Westinghouse Air Brake Technologies Corporation's Expenses
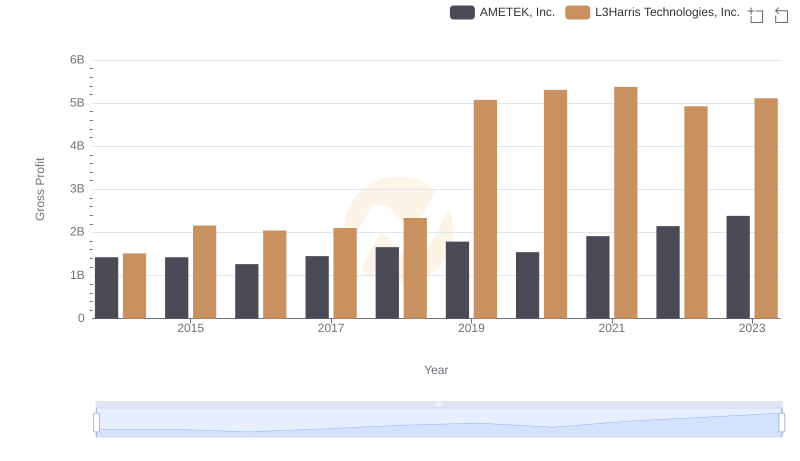
AMETEK, Inc. vs L3Harris Technologies, Inc.: A Gross Profit Performance Breakdown
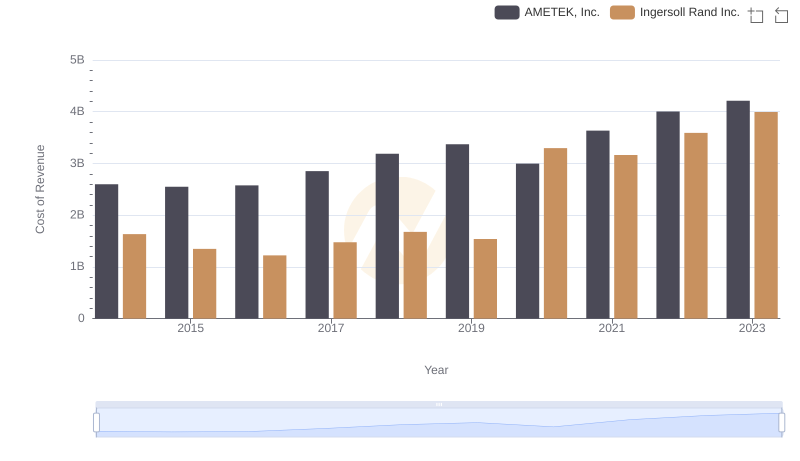
Cost of Revenue: Key Insights for AMETEK, Inc. and Ingersoll Rand Inc.
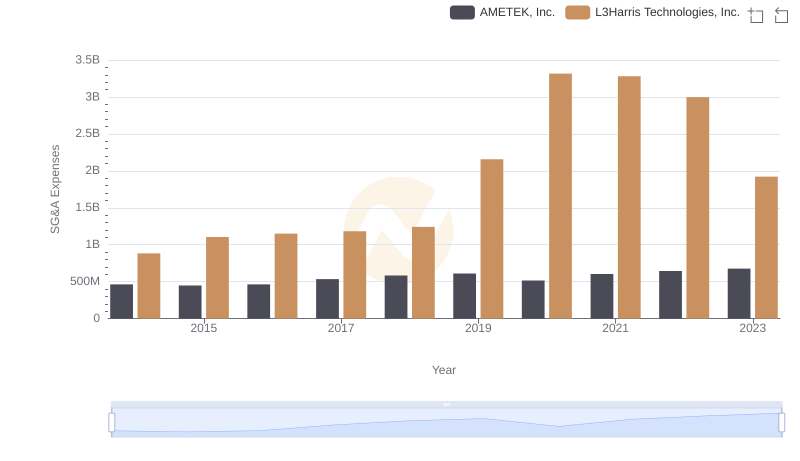
Operational Costs Compared: SG&A Analysis of AMETEK, Inc. and L3Harris Technologies, Inc.
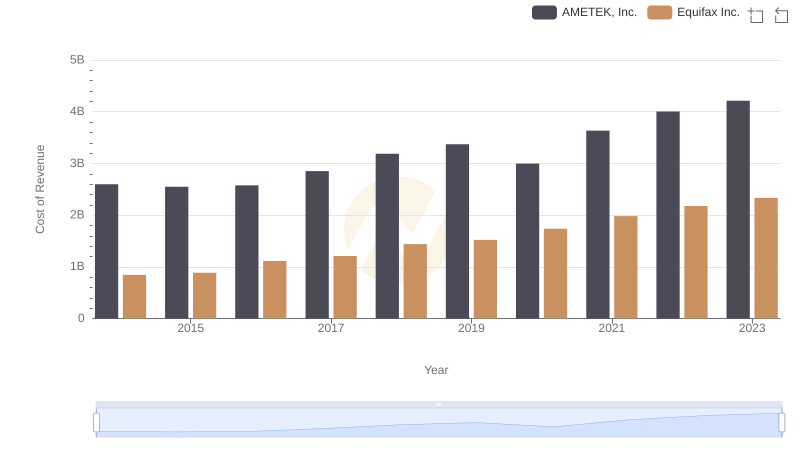
AMETEK, Inc. vs Equifax Inc.: Efficiency in Cost of Revenue Explored
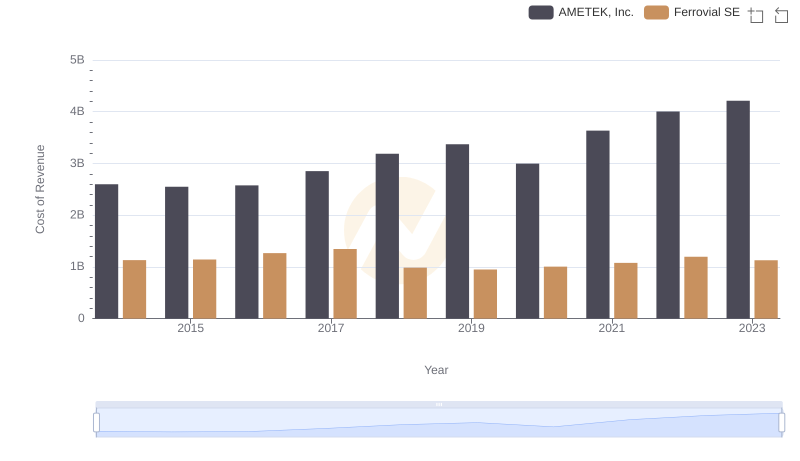
Cost of Revenue Trends: AMETEK, Inc. vs Ferrovial SE
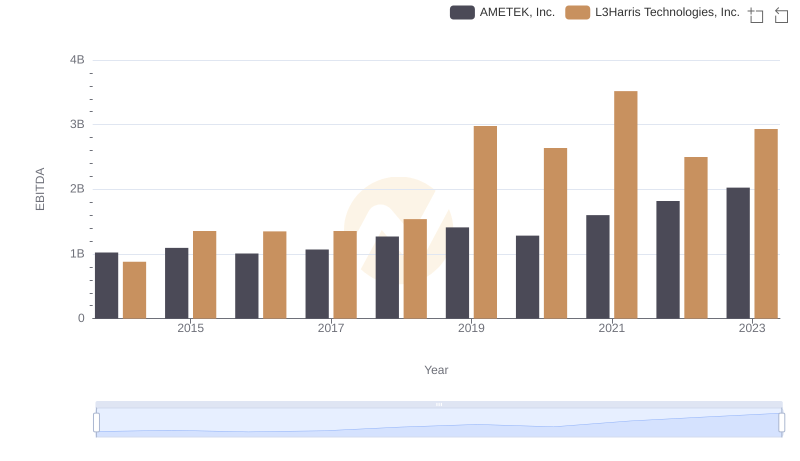
Professional EBITDA Benchmarking: AMETEK, Inc. vs L3Harris Technologies, Inc.