| __timestamp | AMETEK, Inc. | Verisk Analytics, Inc. |
|---|---|---|
| Wednesday, January 1, 2014 | 2597017000 | 716598000 |
| Thursday, January 1, 2015 | 2549280000 | 803274000 |
| Friday, January 1, 2016 | 2575220000 | 714400000 |
| Sunday, January 1, 2017 | 2851431000 | 783800000 |
| Monday, January 1, 2018 | 3186310000 | 886200000 |
| Tuesday, January 1, 2019 | 3370897000 | 976800000 |
| Wednesday, January 1, 2020 | 2996515000 | 993900000 |
| Friday, January 1, 2021 | 3633900000 | 1057800000 |
| Saturday, January 1, 2022 | 4005261000 | 824600000 |
| Sunday, January 1, 2023 | 4212484999 | 876500000 |
| Monday, January 1, 2024 | 0 |
Cracking the code
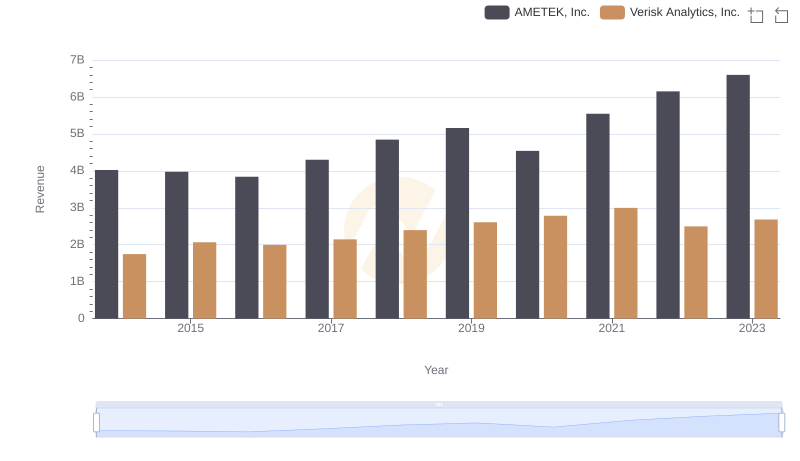
In the ever-evolving landscape of the financial world, understanding the cost of revenue is crucial for investors and analysts alike. This metric, which represents the direct costs attributable to the production of goods sold by a company, offers a window into operational efficiency.
From 2014 to 2023, AMETEK, Inc. has consistently outpaced Verisk Analytics, Inc. in terms of cost of revenue. AMETEK's cost of revenue has surged by approximately 62%, peaking in 2023, while Verisk Analytics saw a more modest increase of around 22% over the same period. This stark contrast highlights AMETEK's expansive growth strategy compared to Verisk's more conservative approach.
The data reveals a significant upward trend for AMETEK, particularly from 2020 onwards, suggesting a robust expansion in their operations. Meanwhile, Verisk's cost of revenue remained relatively stable, indicating a focus on maintaining operational efficiency.
AMETEK, Inc. vs Verisk Analytics, Inc.: Examining Key Revenue Metrics
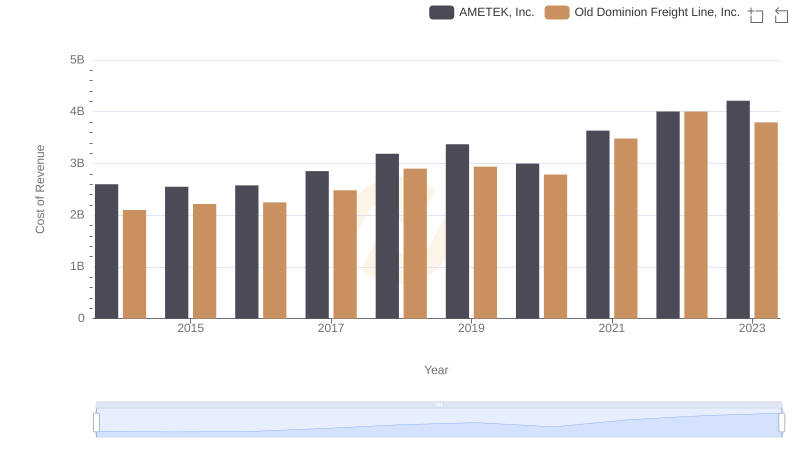
Cost of Revenue: Key Insights for AMETEK, Inc. and Old Dominion Freight Line, Inc.
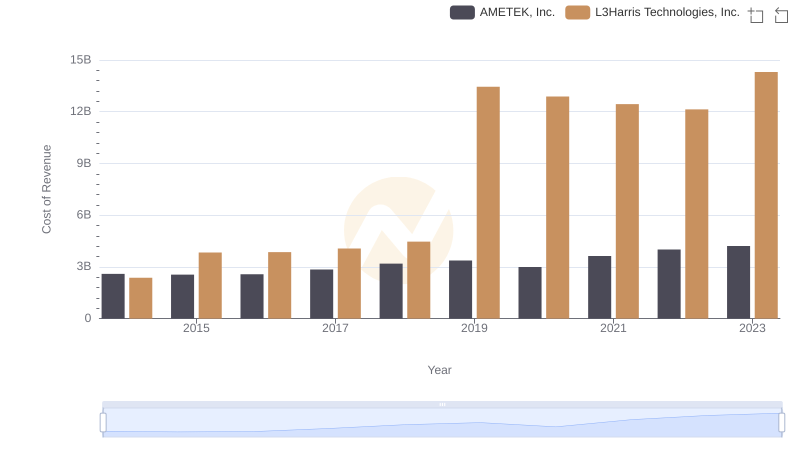
Cost Insights: Breaking Down AMETEK, Inc. and L3Harris Technologies, Inc.'s Expenses
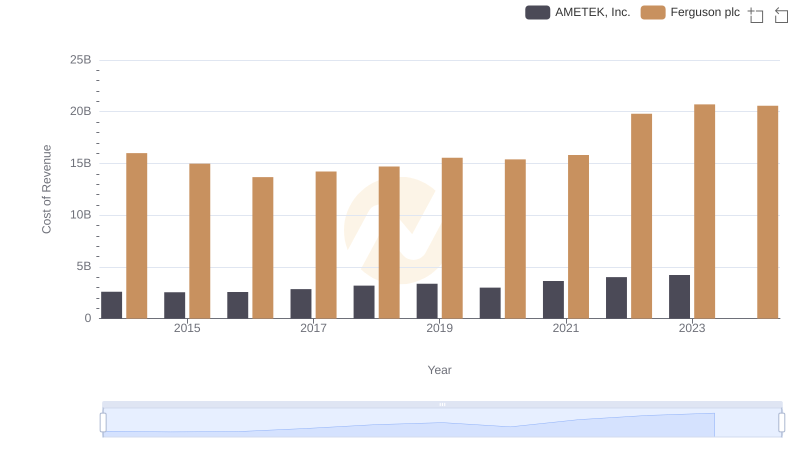
AMETEK, Inc. vs Ferguson plc: Efficiency in Cost of Revenue Explored
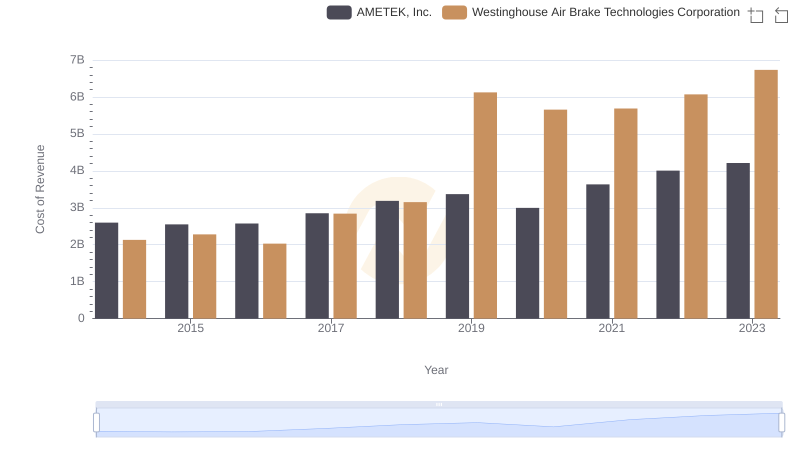
Cost Insights: Breaking Down AMETEK, Inc. and Westinghouse Air Brake Technologies Corporation's Expenses
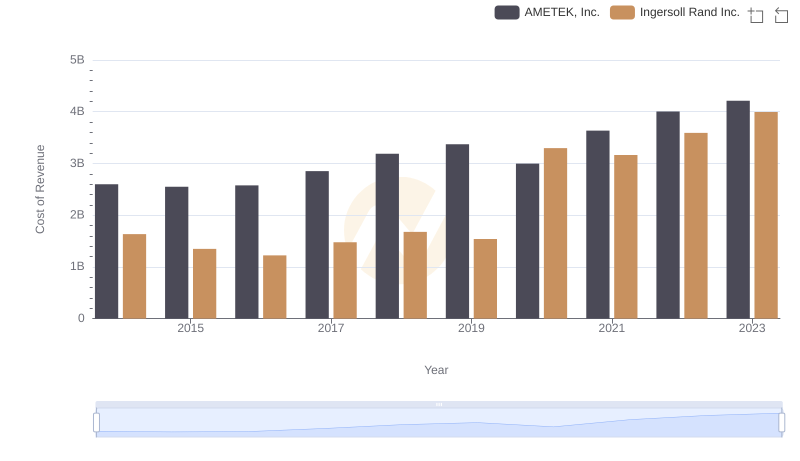
Cost of Revenue: Key Insights for AMETEK, Inc. and Ingersoll Rand Inc.
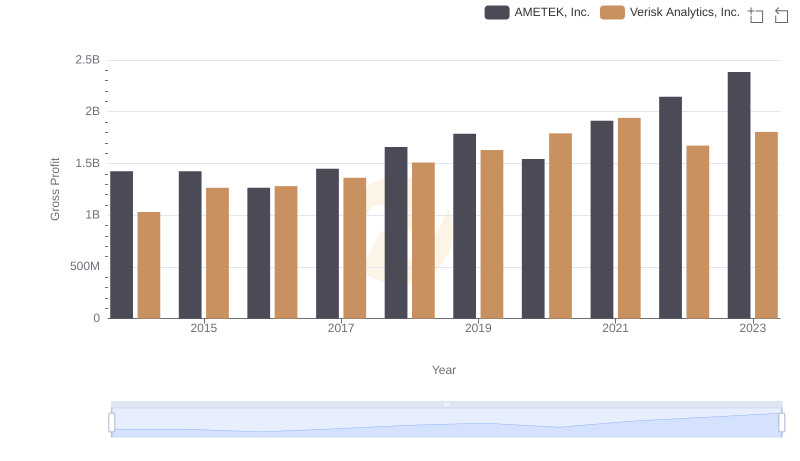
AMETEK, Inc. and Verisk Analytics, Inc.: A Detailed Gross Profit Analysis
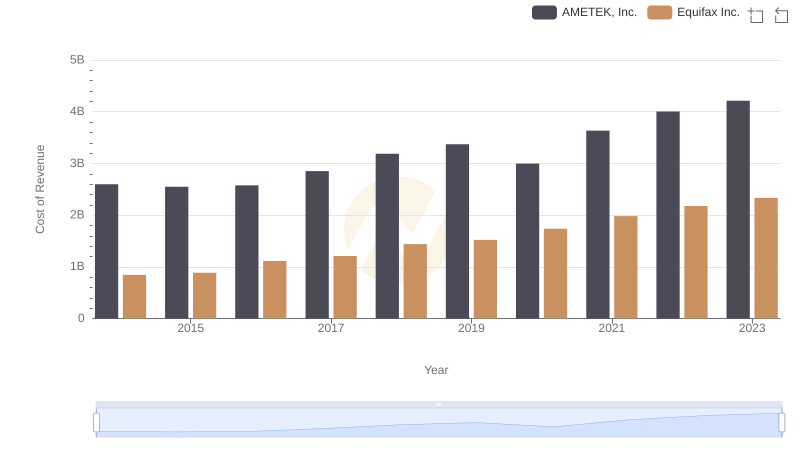
AMETEK, Inc. vs Equifax Inc.: Efficiency in Cost of Revenue Explored
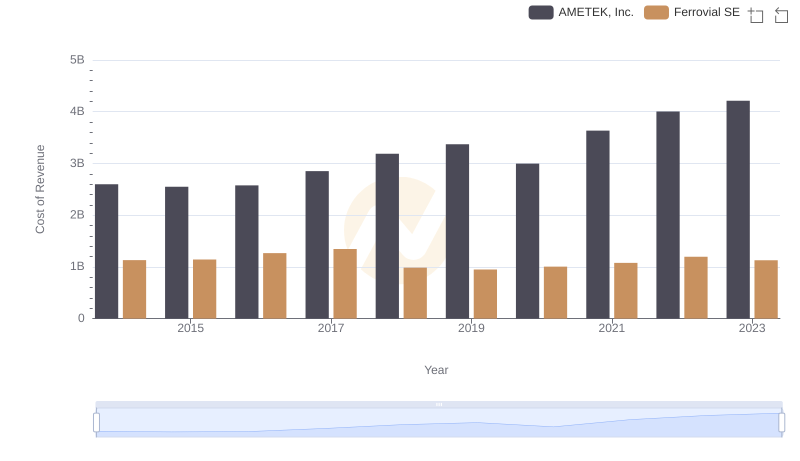
Cost of Revenue Trends: AMETEK, Inc. vs Ferrovial SE
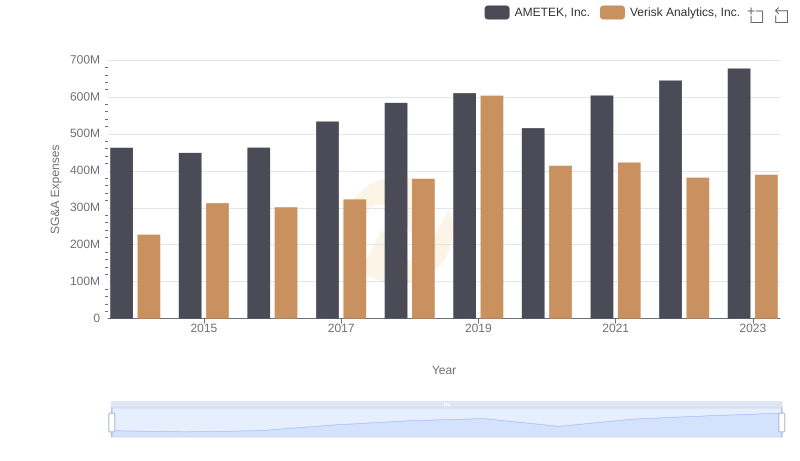
Comparing SG&A Expenses: AMETEK, Inc. vs Verisk Analytics, Inc. Trends and Insights
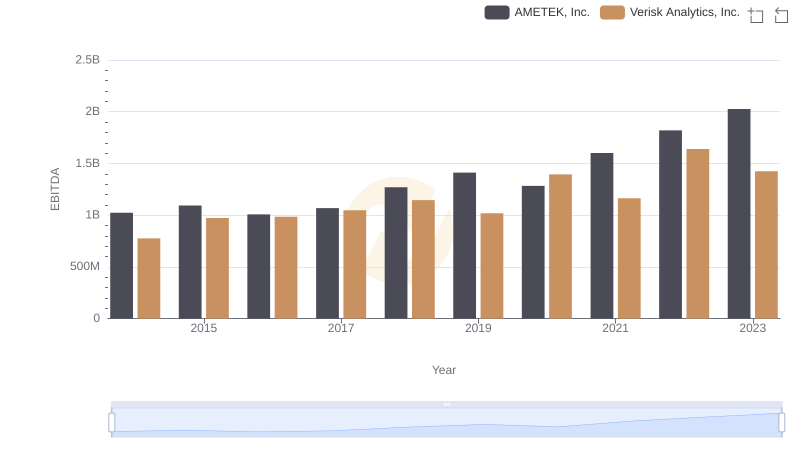
Professional EBITDA Benchmarking: AMETEK, Inc. vs Verisk Analytics, Inc.