| __timestamp | AMETEK, Inc. | Verisk Analytics, Inc. |
|---|---|---|
| Wednesday, January 1, 2014 | 462637000 | 227306000 |
| Thursday, January 1, 2015 | 448592000 | 312690000 |
| Friday, January 1, 2016 | 462970000 | 301600000 |
| Sunday, January 1, 2017 | 533645000 | 322800000 |
| Monday, January 1, 2018 | 584022000 | 378700000 |
| Tuesday, January 1, 2019 | 610280000 | 603500000 |
| Wednesday, January 1, 2020 | 515630000 | 413900000 |
| Friday, January 1, 2021 | 603944000 | 422700000 |
| Saturday, January 1, 2022 | 644577000 | 381500000 |
| Sunday, January 1, 2023 | 677006000 | 389300000 |
| Monday, January 1, 2024 | 696905000 |
Cracking the code
In the ever-evolving landscape of corporate finance, understanding the trends in Selling, General, and Administrative (SG&A) expenses is crucial. From 2014 to 2023, AMETEK, Inc. and Verisk Analytics, Inc. have shown distinct trajectories in their SG&A expenses. AMETEK, Inc. has seen a steady increase, with expenses growing by approximately 46% over the decade. In contrast, Verisk Analytics, Inc. experienced a more volatile pattern, peaking in 2019 with a 166% increase from 2014, before stabilizing in recent years.
This divergence highlights the strategic differences between the two companies. AMETEK's consistent growth suggests a stable expansion strategy, while Verisk's fluctuations may indicate adaptive strategies in response to market conditions. As we move forward, these trends offer valuable insights into the operational efficiencies and strategic priorities of these industry leaders.
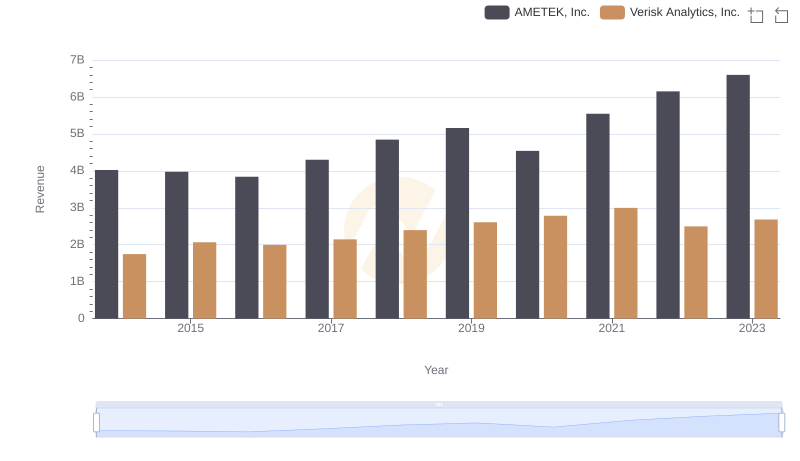
AMETEK, Inc. vs Verisk Analytics, Inc.: Examining Key Revenue Metrics
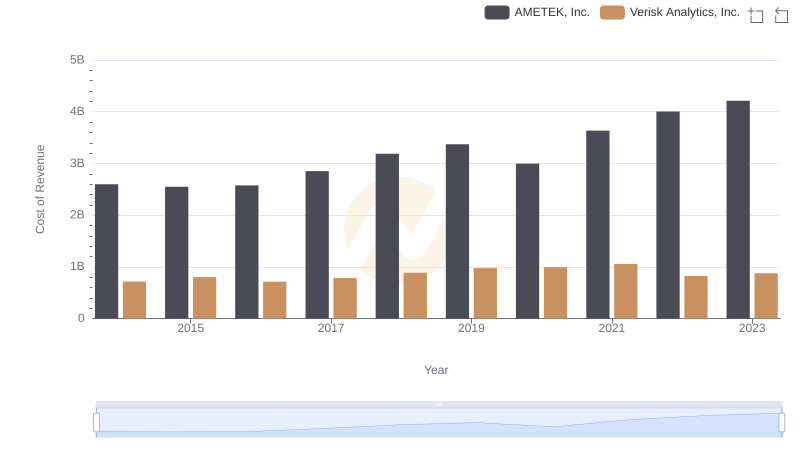
Cost of Revenue Comparison: AMETEK, Inc. vs Verisk Analytics, Inc.
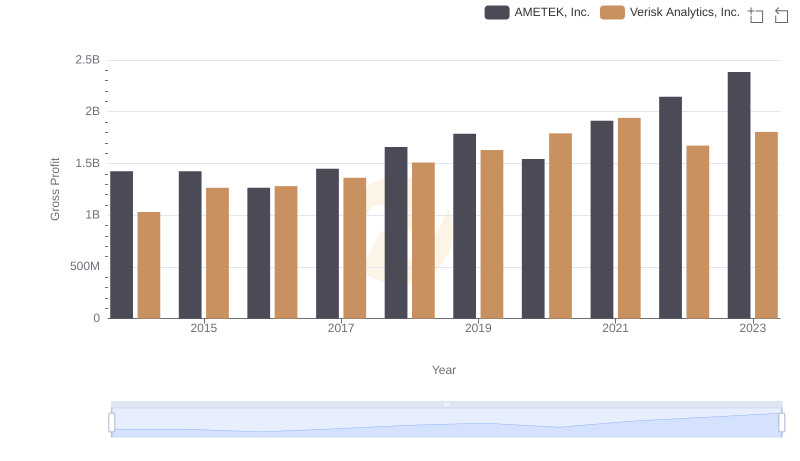
AMETEK, Inc. and Verisk Analytics, Inc.: A Detailed Gross Profit Analysis
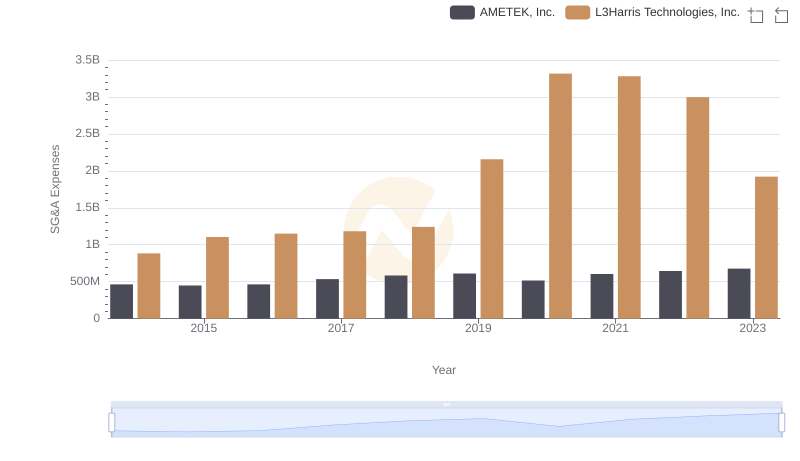
Operational Costs Compared: SG&A Analysis of AMETEK, Inc. and L3Harris Technologies, Inc.
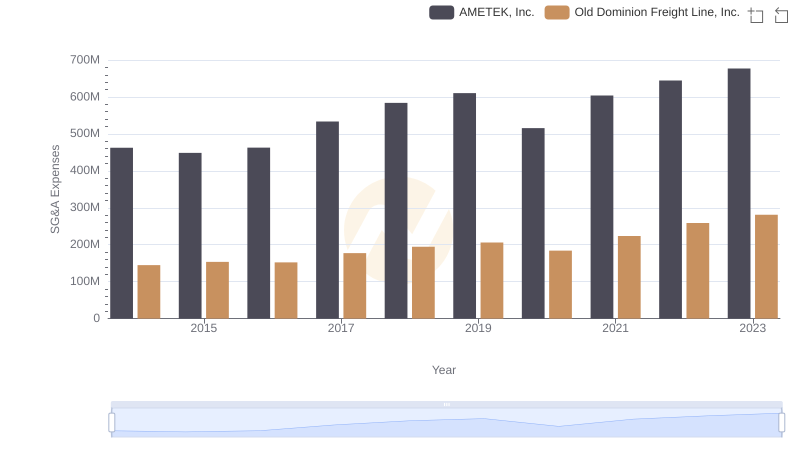
Who Optimizes SG&A Costs Better? AMETEK, Inc. or Old Dominion Freight Line, Inc.
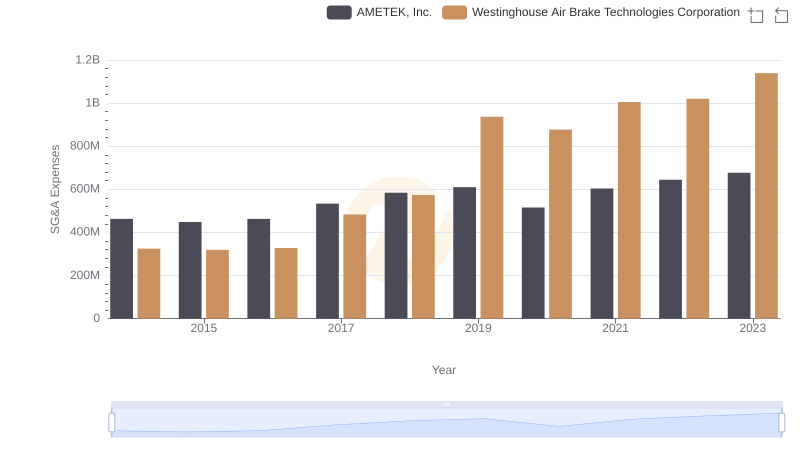
Selling, General, and Administrative Costs: AMETEK, Inc. vs Westinghouse Air Brake Technologies Corporation
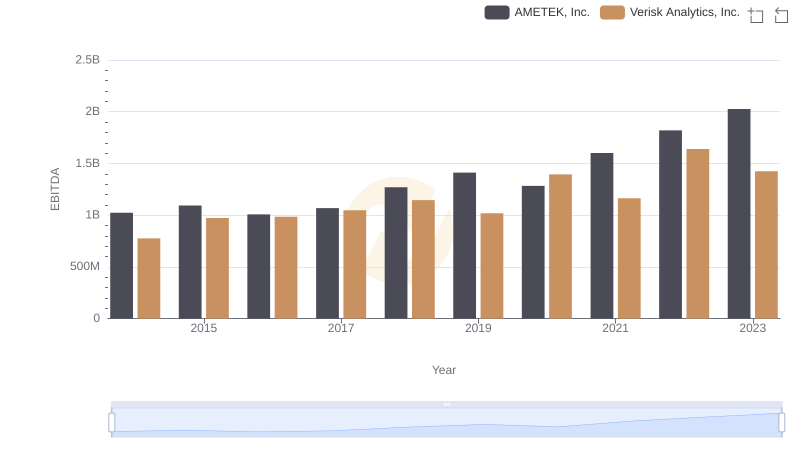
Professional EBITDA Benchmarking: AMETEK, Inc. vs Verisk Analytics, Inc.
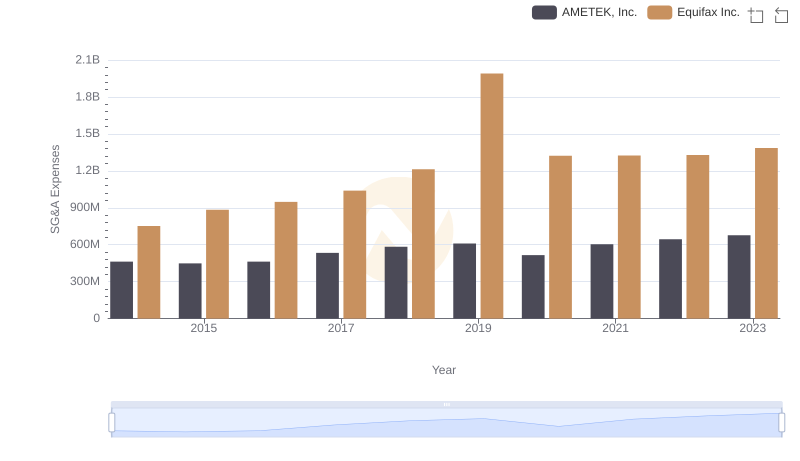
Cost Management Insights: SG&A Expenses for AMETEK, Inc. and Equifax Inc.
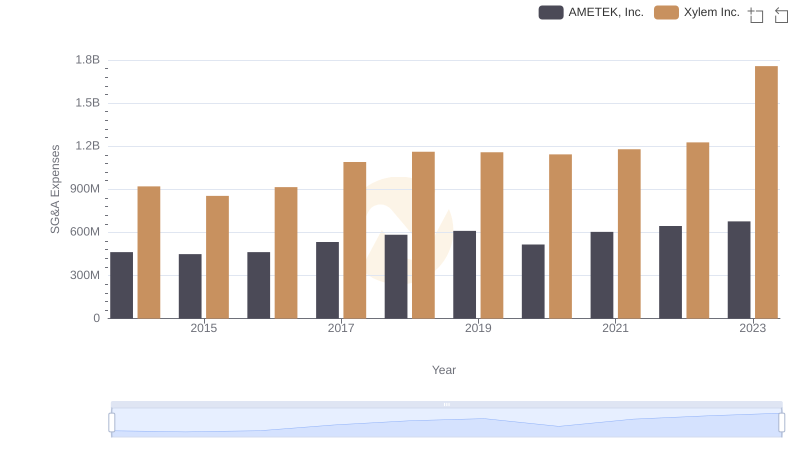
Comparing SG&A Expenses: AMETEK, Inc. vs Xylem Inc. Trends and Insights