| __timestamp | AMETEK, Inc. | Verisk Analytics, Inc. |
|---|---|---|
| Wednesday, January 1, 2014 | 1023344000 | 776000000 |
| Thursday, January 1, 2015 | 1093776000 | 972500000 |
| Friday, January 1, 2016 | 1007213000 | 985300000 |
| Sunday, January 1, 2017 | 1068174000 | 1047800000 |
| Monday, January 1, 2018 | 1269415000 | 1145500000 |
| Tuesday, January 1, 2019 | 1411422000 | 1018900000 |
| Wednesday, January 1, 2020 | 1283159000 | 1393800000 |
| Friday, January 1, 2021 | 1600782000 | 1163700000 |
| Saturday, January 1, 2022 | 1820119000 | 1639800000 |
| Sunday, January 1, 2023 | 2025843000 | 1424100000 |
| Monday, January 1, 2024 | 1779562000 |
In pursuit of knowledge
In the ever-evolving landscape of financial performance, EBITDA serves as a crucial metric for evaluating a company's operational efficiency. This analysis focuses on AMETEK, Inc. and Verisk Analytics, Inc., two industry leaders, over a decade from 2014 to 2023.
AMETEK, Inc. has demonstrated a robust growth trajectory, with its EBITDA increasing by approximately 98% from 2014 to 2023. In contrast, Verisk Analytics, Inc. experienced a more modest growth of around 83% during the same period. Notably, AMETEK's EBITDA surpassed Verisk's in 2023, reaching a peak of $2.03 billion, compared to Verisk's $1.42 billion.
The data reveals that AMETEK consistently outperformed Verisk in terms of EBITDA, except in 2020, when Verisk briefly took the lead. This trend underscores AMETEK's resilience and strategic prowess in navigating market challenges.
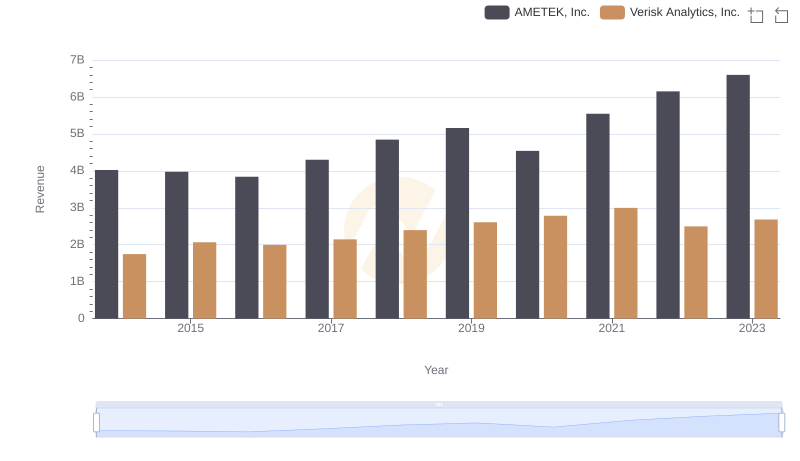
AMETEK, Inc. vs Verisk Analytics, Inc.: Examining Key Revenue Metrics
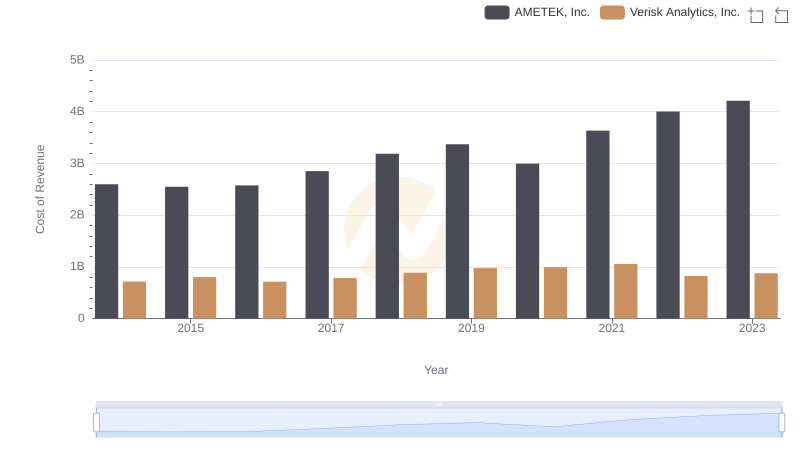
Cost of Revenue Comparison: AMETEK, Inc. vs Verisk Analytics, Inc.
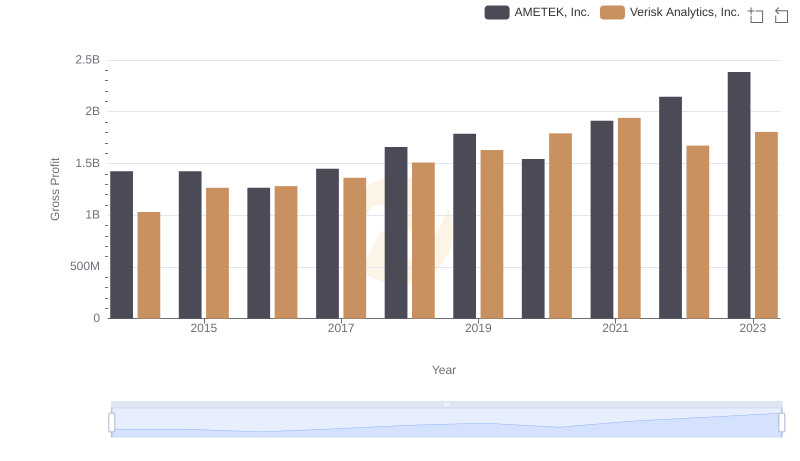
AMETEK, Inc. and Verisk Analytics, Inc.: A Detailed Gross Profit Analysis
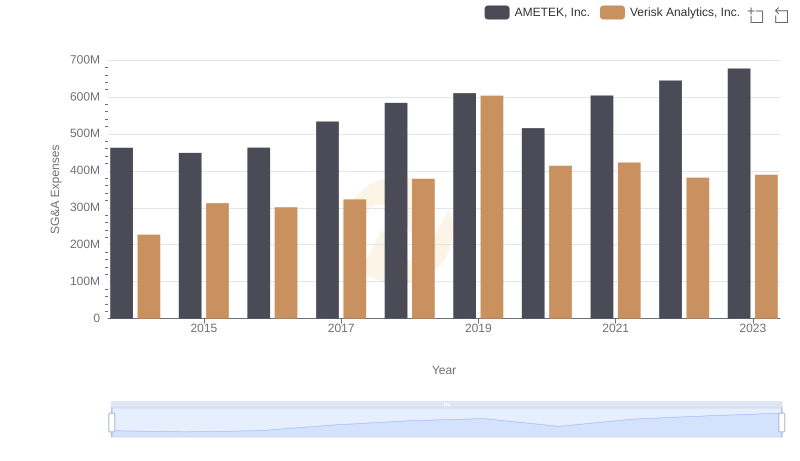
Comparing SG&A Expenses: AMETEK, Inc. vs Verisk Analytics, Inc. Trends and Insights
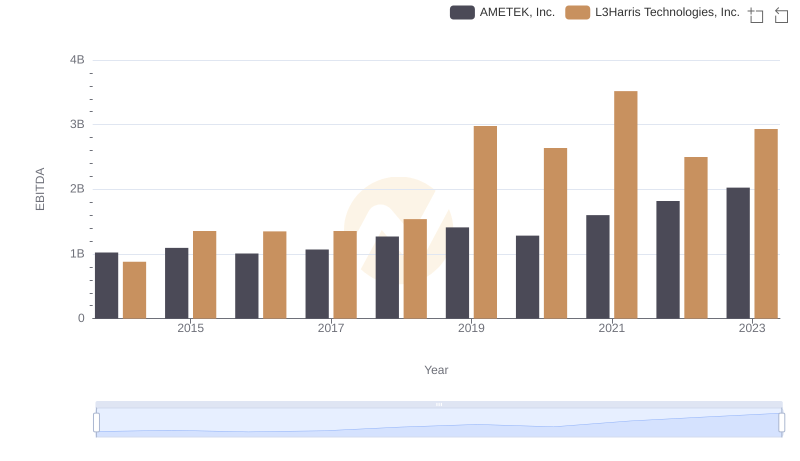
Professional EBITDA Benchmarking: AMETEK, Inc. vs L3Harris Technologies, Inc.
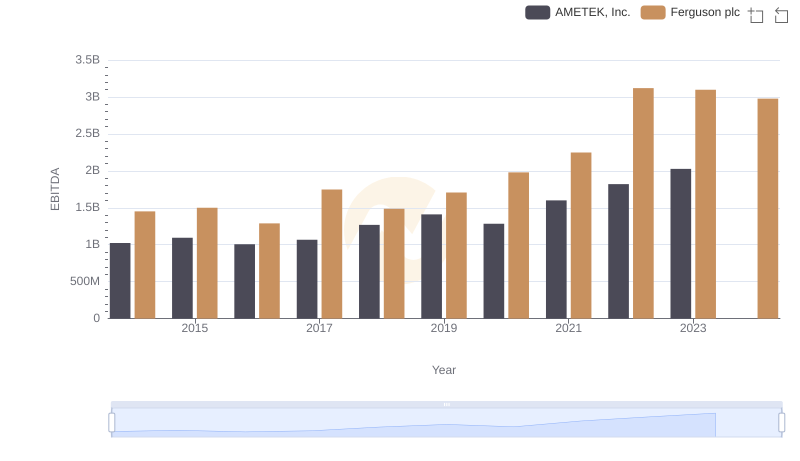
A Side-by-Side Analysis of EBITDA: AMETEK, Inc. and Ferguson plc
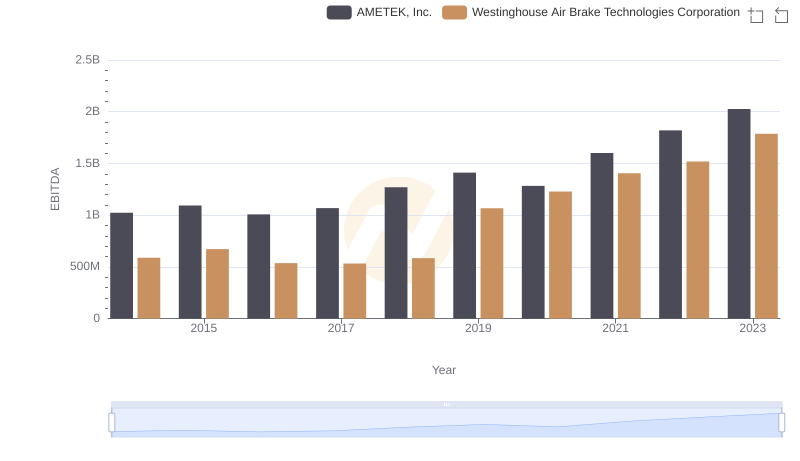
A Professional Review of EBITDA: AMETEK, Inc. Compared to Westinghouse Air Brake Technologies Corporation
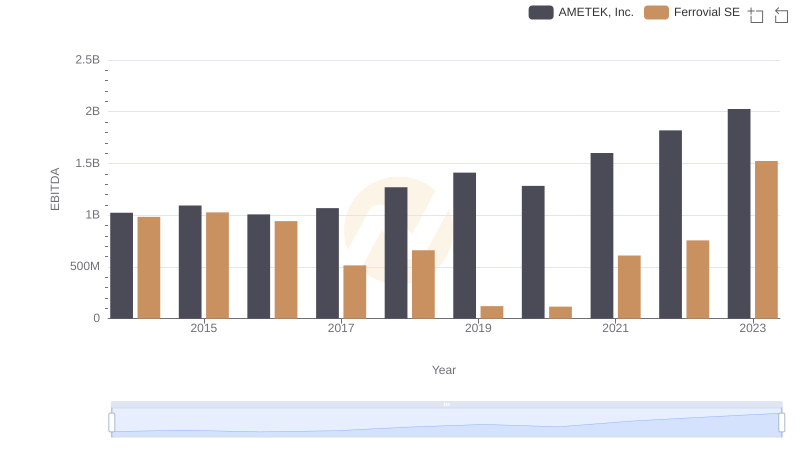
A Side-by-Side Analysis of EBITDA: AMETEK, Inc. and Ferrovial SE
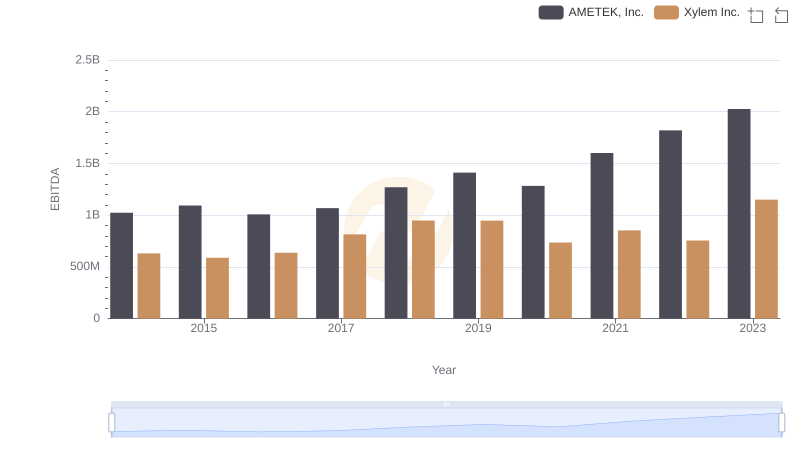
Professional EBITDA Benchmarking: AMETEK, Inc. vs Xylem Inc.
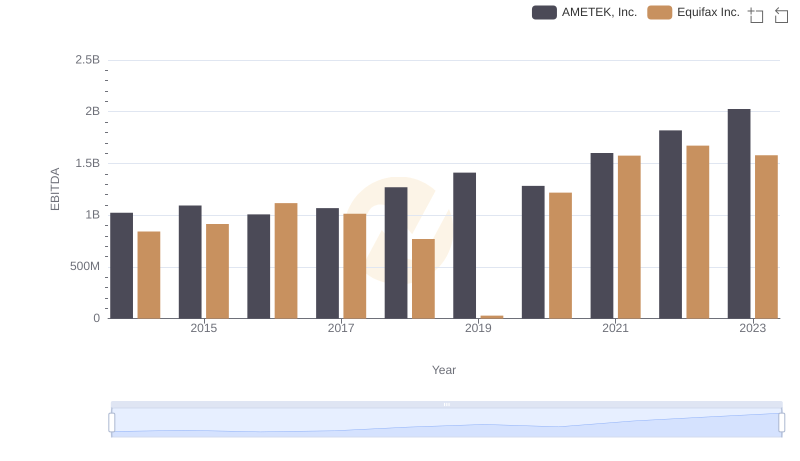
Comparative EBITDA Analysis: AMETEK, Inc. vs Equifax Inc.
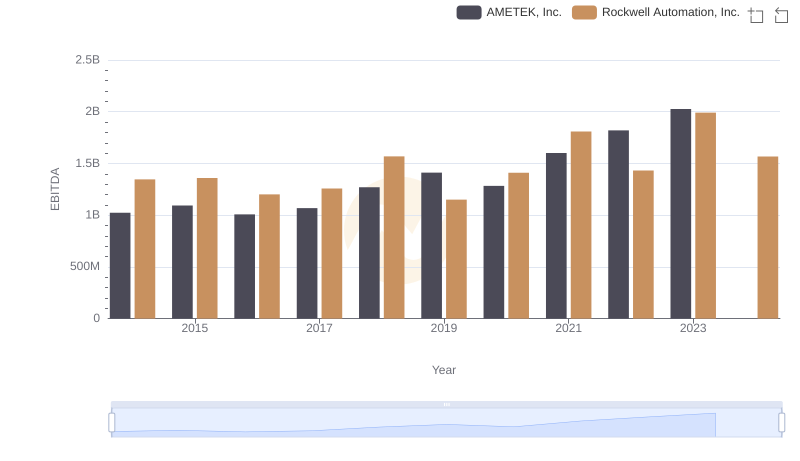
Professional EBITDA Benchmarking: AMETEK, Inc. vs Rockwell Automation, Inc.