| __timestamp | AMETEK, Inc. | Xylem Inc. |
|---|---|---|
| Wednesday, January 1, 2014 | 1023344000 | 631000000 |
| Thursday, January 1, 2015 | 1093776000 | 588000000 |
| Friday, January 1, 2016 | 1007213000 | 637000000 |
| Sunday, January 1, 2017 | 1068174000 | 814000000 |
| Monday, January 1, 2018 | 1269415000 | 948000000 |
| Tuesday, January 1, 2019 | 1411422000 | 947000000 |
| Wednesday, January 1, 2020 | 1283159000 | 736000000 |
| Friday, January 1, 2021 | 1600782000 | 853000000 |
| Saturday, January 1, 2022 | 1820119000 | 755000000 |
| Sunday, January 1, 2023 | 2025843000 | 1150000000 |
| Monday, January 1, 2024 | 1779562000 |
Cracking the code
In the competitive landscape of industrial technology, AMETEK, Inc. and Xylem Inc. have emerged as key players. Over the past decade, AMETEK has consistently outperformed Xylem in terms of EBITDA, showcasing a robust growth trajectory. From 2014 to 2023, AMETEK's EBITDA surged by approximately 98%, peaking in 2023, while Xylem's EBITDA grew by about 82% during the same period. This growth highlights AMETEK's strategic prowess in navigating market challenges and capitalizing on opportunities. Notably, 2023 marked a significant year for both companies, with AMETEK achieving its highest EBITDA, reflecting its strong market position. Meanwhile, Xylem's EBITDA also reached a new high, indicating its resilience and adaptability. As the industrial sector continues to evolve, these companies' financial performances offer valuable insights into their operational efficiencies and market strategies.
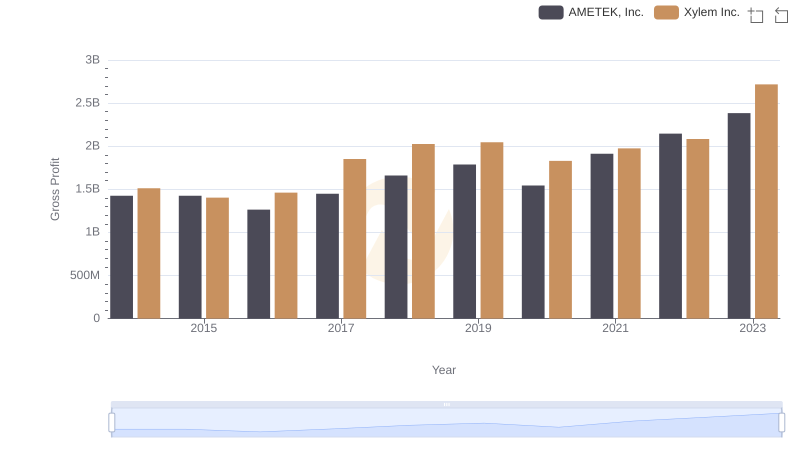
AMETEK, Inc. vs Xylem Inc.: A Gross Profit Performance Breakdown
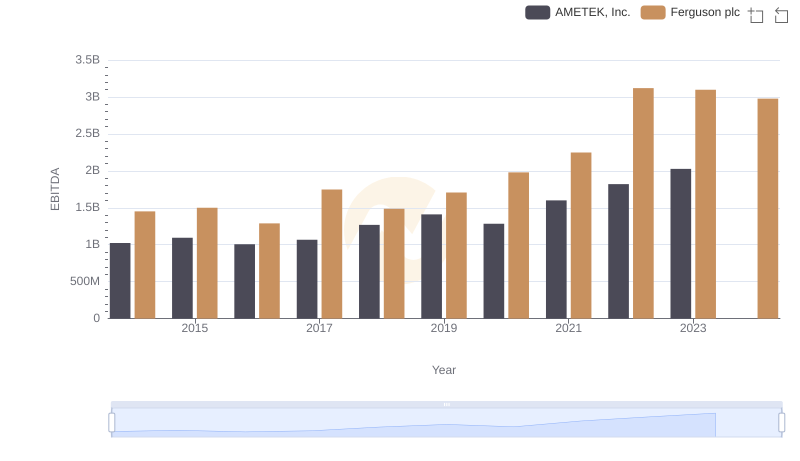
A Side-by-Side Analysis of EBITDA: AMETEK, Inc. and Ferguson plc
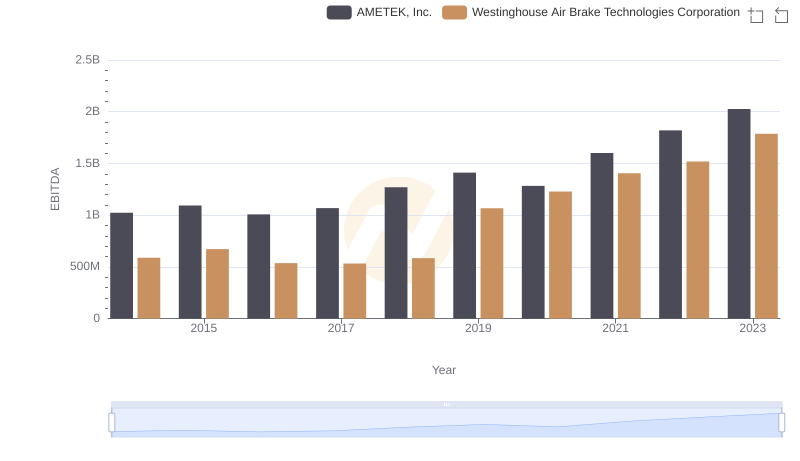
A Professional Review of EBITDA: AMETEK, Inc. Compared to Westinghouse Air Brake Technologies Corporation
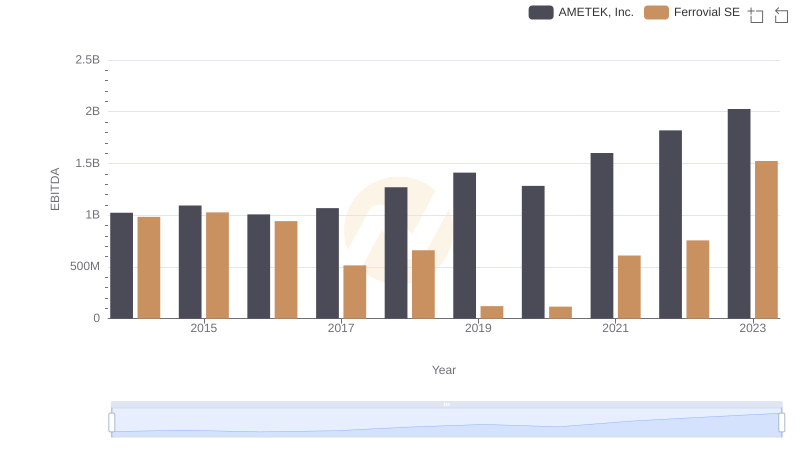
A Side-by-Side Analysis of EBITDA: AMETEK, Inc. and Ferrovial SE
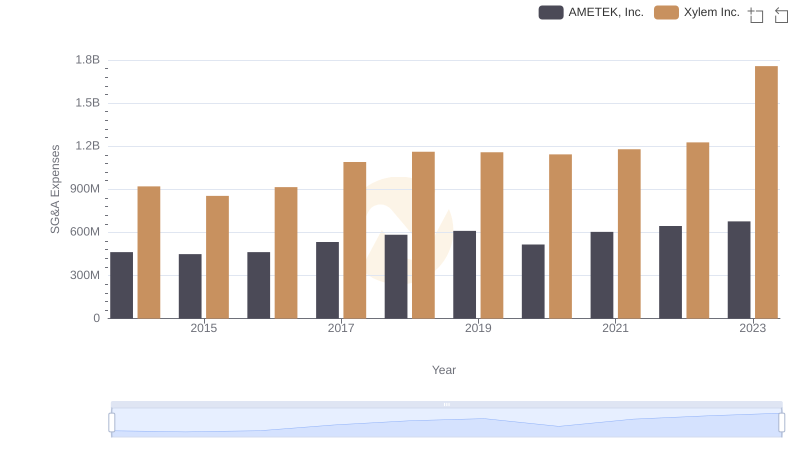
Comparing SG&A Expenses: AMETEK, Inc. vs Xylem Inc. Trends and Insights
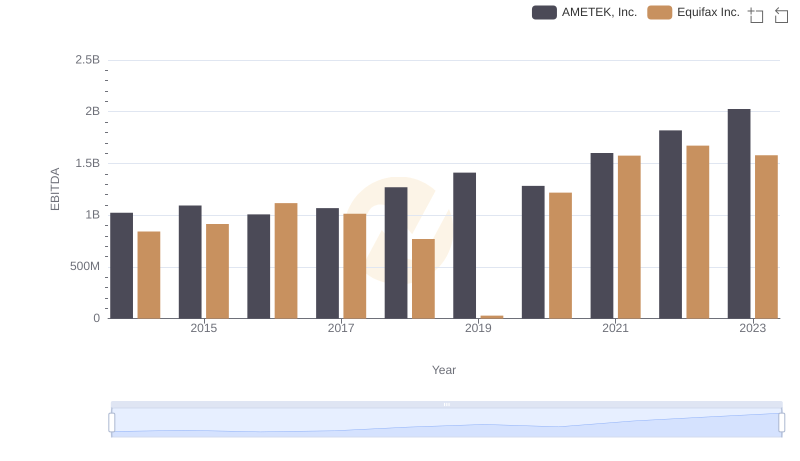
Comparative EBITDA Analysis: AMETEK, Inc. vs Equifax Inc.
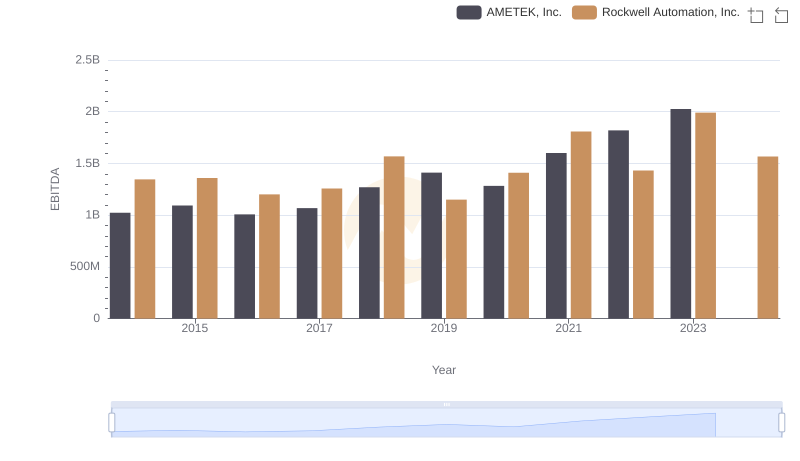
Professional EBITDA Benchmarking: AMETEK, Inc. vs Rockwell Automation, Inc.
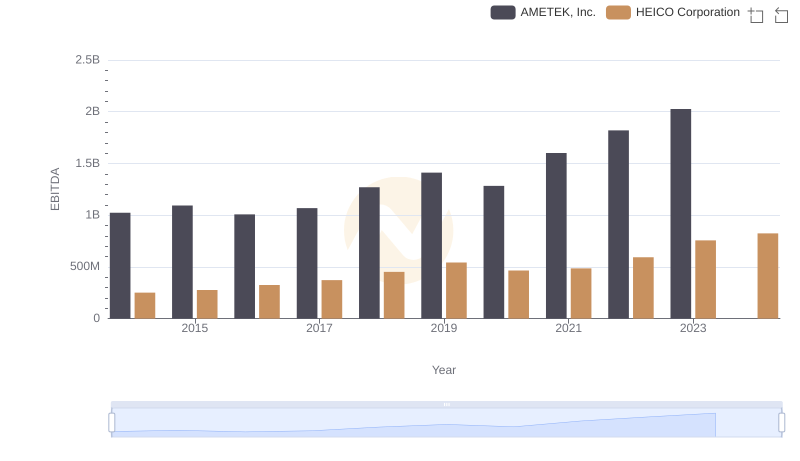
AMETEK, Inc. and HEICO Corporation: A Detailed Examination of EBITDA Performance
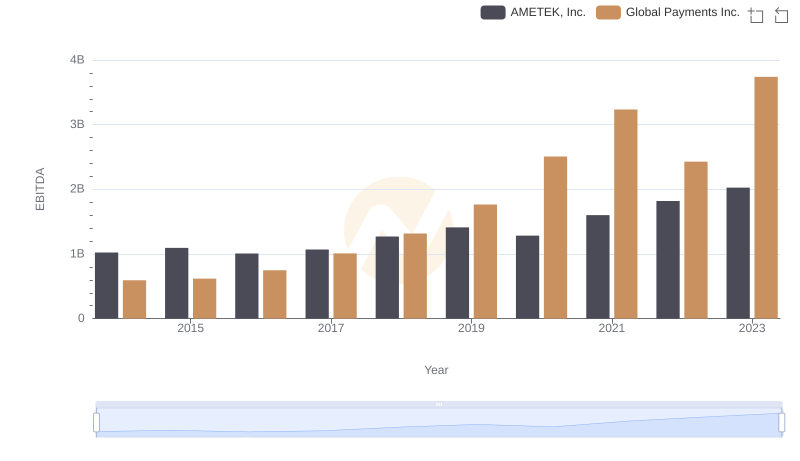
A Side-by-Side Analysis of EBITDA: AMETEK, Inc. and Global Payments Inc.
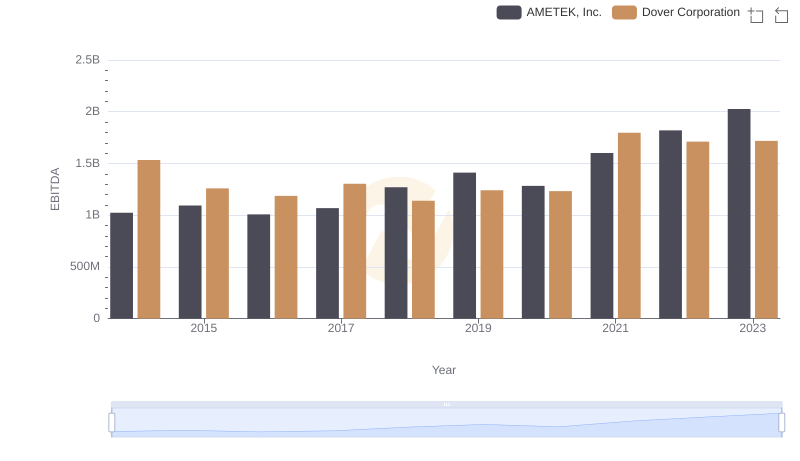
A Professional Review of EBITDA: AMETEK, Inc. Compared to Dover Corporation