| __timestamp | AMETEK, Inc. | Dover Corporation |
|---|---|---|
| Wednesday, January 1, 2014 | 1023344000 | 1533084000 |
| Thursday, January 1, 2015 | 1093776000 | 1259375000 |
| Friday, January 1, 2016 | 1007213000 | 1186472000 |
| Sunday, January 1, 2017 | 1068174000 | 1304041000 |
| Monday, January 1, 2018 | 1269415000 | 1138930000 |
| Tuesday, January 1, 2019 | 1411422000 | 1241114000 |
| Wednesday, January 1, 2020 | 1283159000 | 1232722000 |
| Friday, January 1, 2021 | 1600782000 | 1797268000 |
| Saturday, January 1, 2022 | 1820119000 | 1711499000 |
| Sunday, January 1, 2023 | 2025843000 | 1718774000 |
| Monday, January 1, 2024 | 1779562000 | 1206355000 |
Unleashing insights
In the ever-evolving landscape of industrial manufacturing, AMETEK, Inc. and Dover Corporation have been titans of industry. Over the past decade, these companies have demonstrated resilience and growth, as reflected in their EBITDA performance from 2014 to 2023.
AMETEK, Inc. has shown a remarkable upward trajectory, with its EBITDA growing by nearly 98% over the period. Starting at approximately $1.02 billion in 2014, it reached an impressive $2.03 billion by 2023. This consistent growth underscores AMETEK's strategic prowess in navigating market challenges.
Dover Corporation, while starting stronger with an EBITDA of $1.53 billion in 2014, experienced a more modest growth of around 12% over the same period, reaching $1.72 billion in 2023. Despite fluctuations, Dover's ability to maintain a competitive edge is noteworthy.
Both companies exemplify the dynamic nature of the industrial sector, with AMETEK's rapid growth and Dover's steady performance offering valuable insights into their strategic approaches.
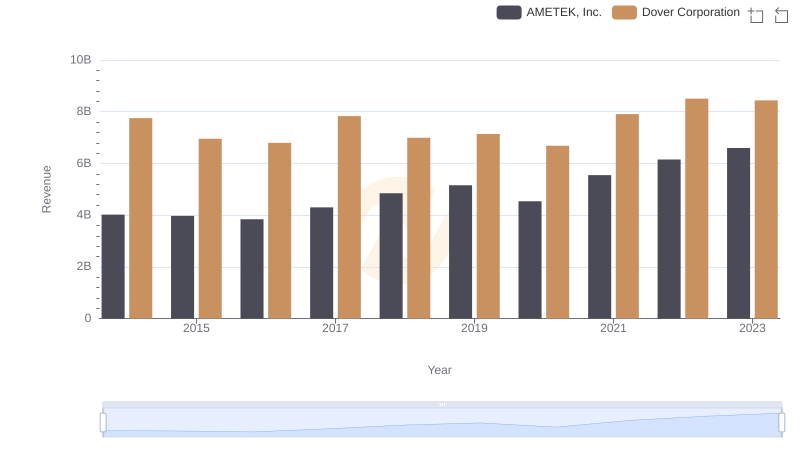
AMETEK, Inc. vs Dover Corporation: Examining Key Revenue Metrics
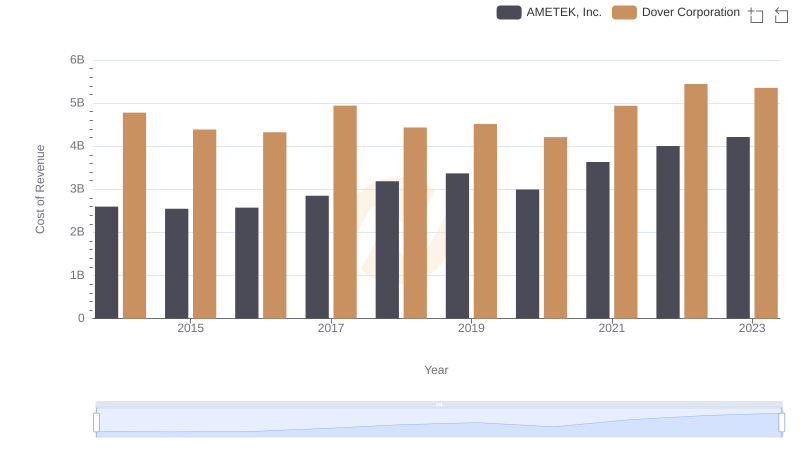
Cost of Revenue: Key Insights for AMETEK, Inc. and Dover Corporation
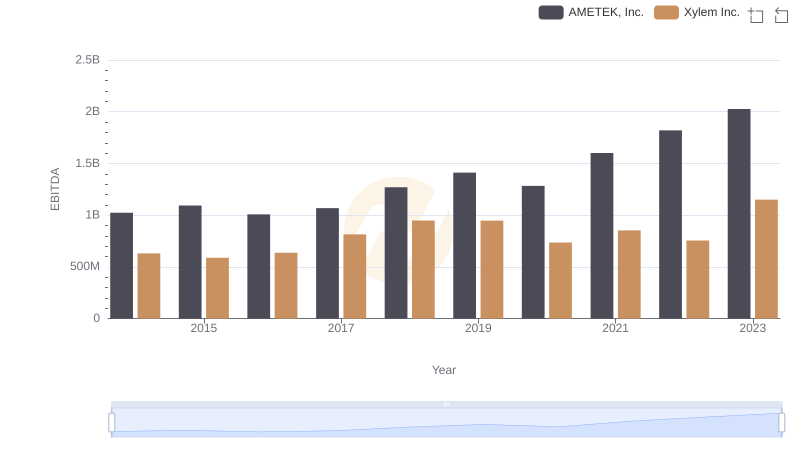
Professional EBITDA Benchmarking: AMETEK, Inc. vs Xylem Inc.
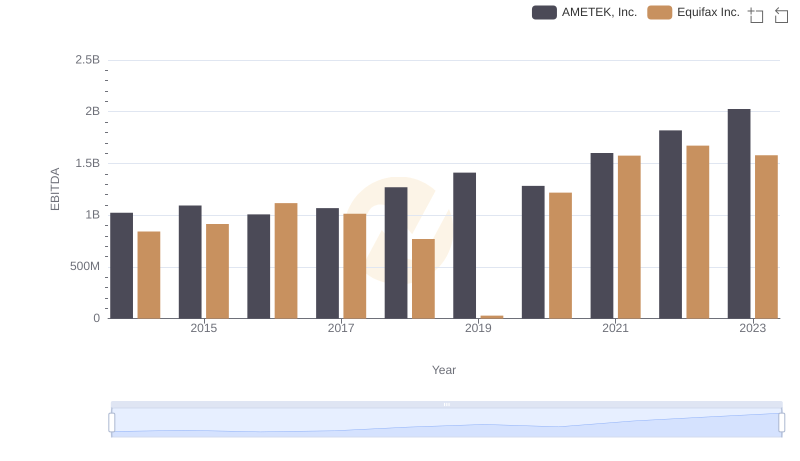
Comparative EBITDA Analysis: AMETEK, Inc. vs Equifax Inc.
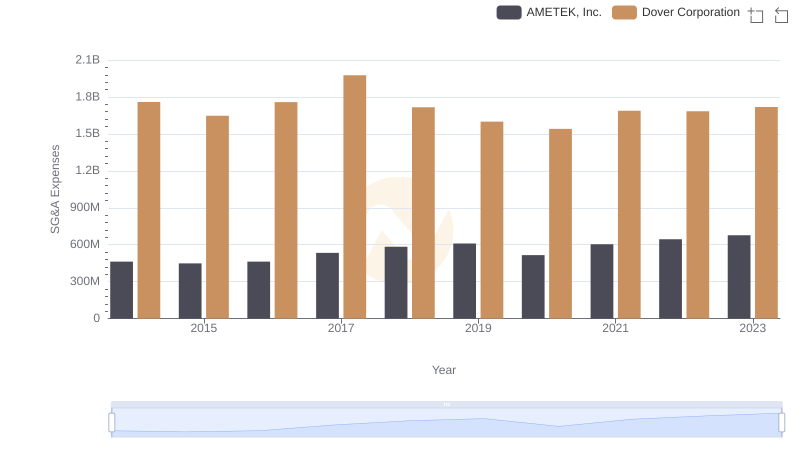
AMETEK, Inc. or Dover Corporation: Who Manages SG&A Costs Better?
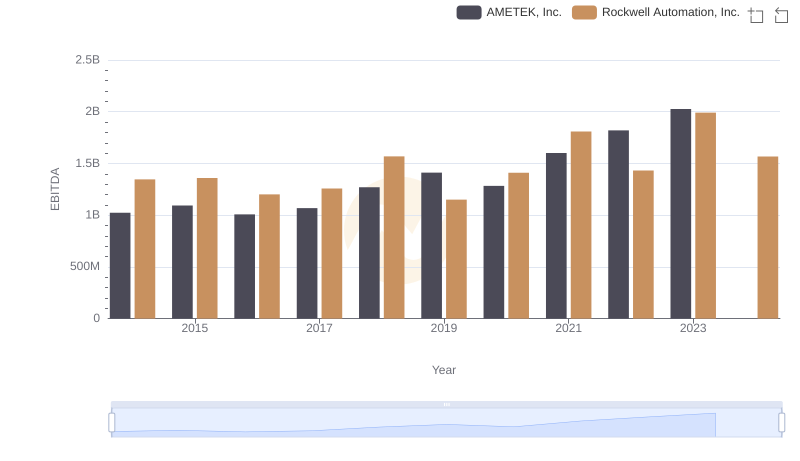
Professional EBITDA Benchmarking: AMETEK, Inc. vs Rockwell Automation, Inc.
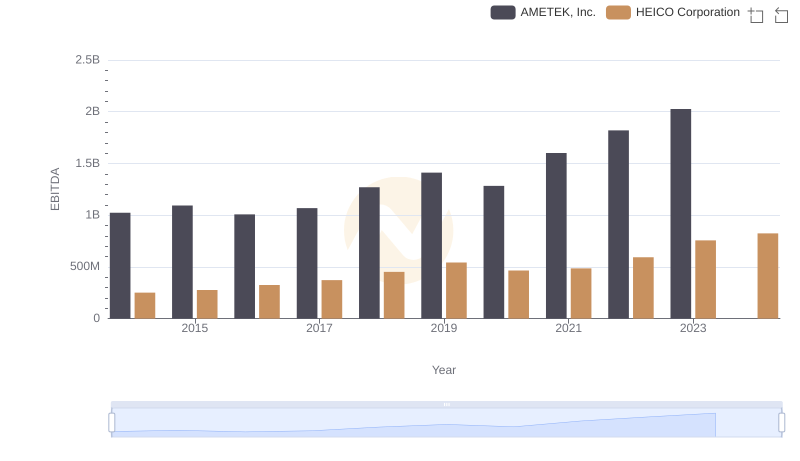
AMETEK, Inc. and HEICO Corporation: A Detailed Examination of EBITDA Performance
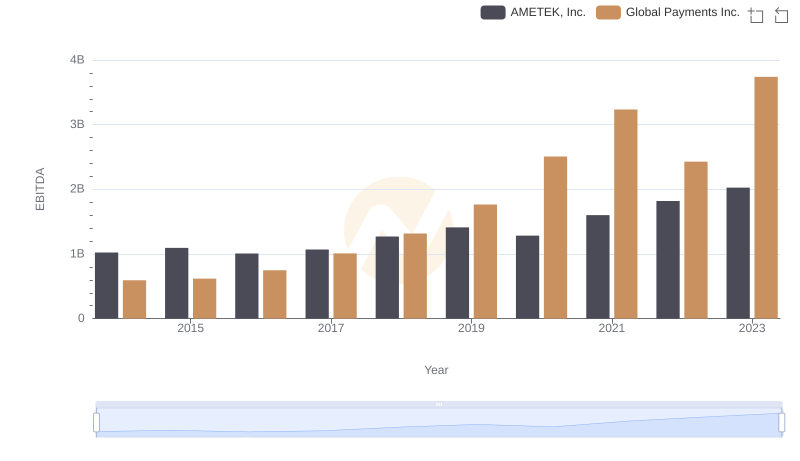
A Side-by-Side Analysis of EBITDA: AMETEK, Inc. and Global Payments Inc.
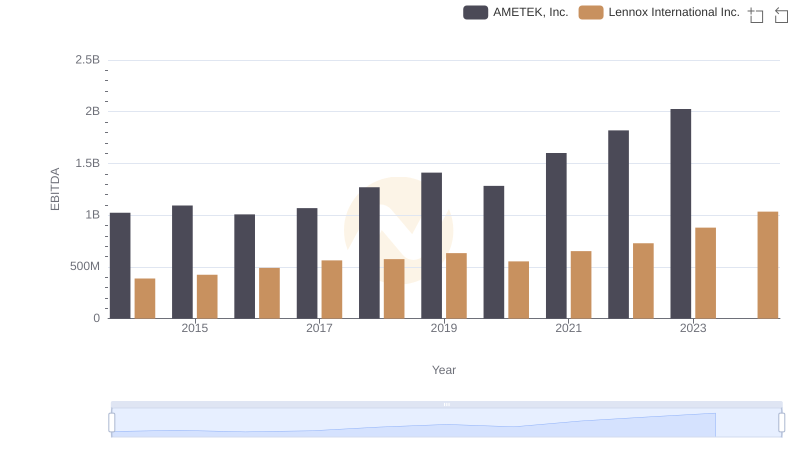
AMETEK, Inc. vs Lennox International Inc.: In-Depth EBITDA Performance Comparison
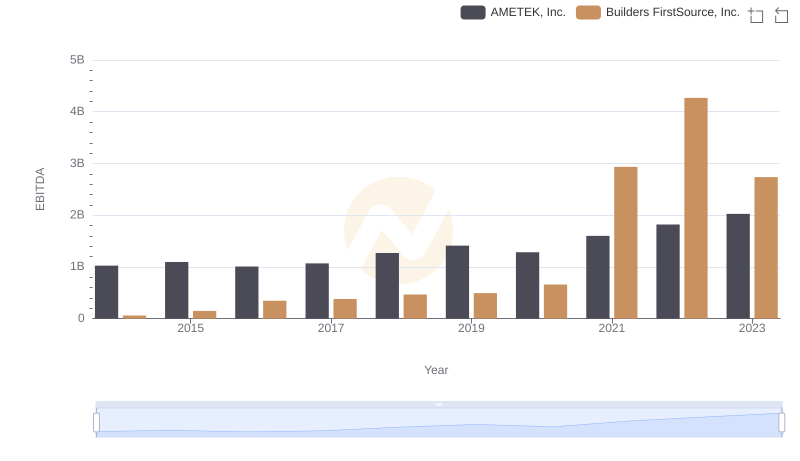
EBITDA Metrics Evaluated: AMETEK, Inc. vs Builders FirstSource, Inc.