| __timestamp | AMETEK, Inc. | Rockwell Automation, Inc. |
|---|---|---|
| Wednesday, January 1, 2014 | 1023344000 | 1346000000 |
| Thursday, January 1, 2015 | 1093776000 | 1359100000 |
| Friday, January 1, 2016 | 1007213000 | 1200700000 |
| Sunday, January 1, 2017 | 1068174000 | 1258400000 |
| Monday, January 1, 2018 | 1269415000 | 1568400000 |
| Tuesday, January 1, 2019 | 1411422000 | 1150200000 |
| Wednesday, January 1, 2020 | 1283159000 | 1410200000 |
| Friday, January 1, 2021 | 1600782000 | 1808300000 |
| Saturday, January 1, 2022 | 1820119000 | 1432100000 |
| Sunday, January 1, 2023 | 2025843000 | 1990700000 |
| Monday, January 1, 2024 | 1779562000 | 1567500000 |
Data in motion
In the competitive landscape of industrial automation, AMETEK, Inc. and Rockwell Automation, Inc. have been pivotal players. Over the past decade, these companies have demonstrated resilience and growth, with their EBITDA figures reflecting their financial health and operational efficiency. From 2014 to 2023, AMETEK's EBITDA grew by approximately 98%, showcasing a robust upward trajectory. Meanwhile, Rockwell Automation experienced a 48% increase in the same period, indicating steady growth despite market fluctuations.
This analysis underscores the dynamic nature of the industrial sector and the strategic maneuvers of these industry giants.
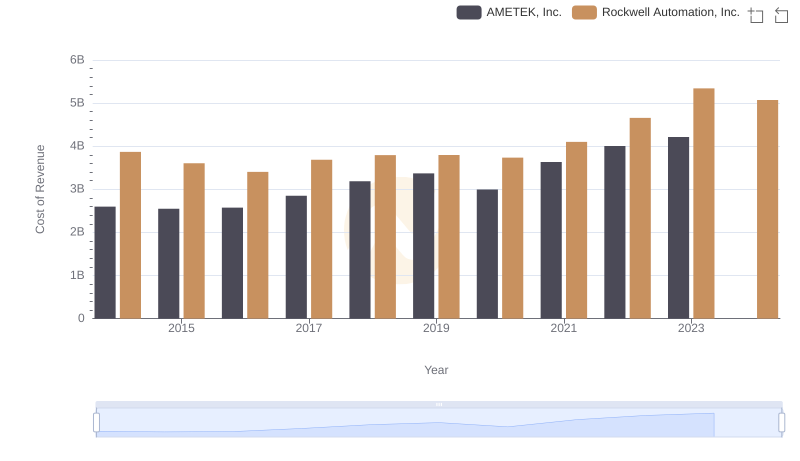
Cost of Revenue Trends: AMETEK, Inc. vs Rockwell Automation, Inc.
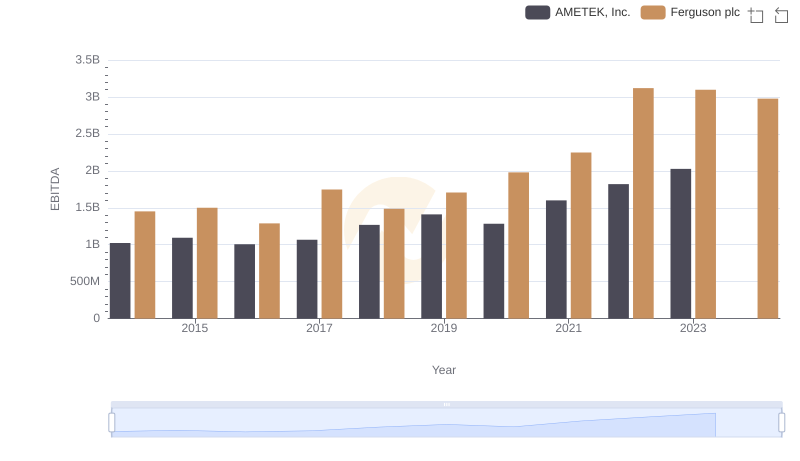
A Side-by-Side Analysis of EBITDA: AMETEK, Inc. and Ferguson plc
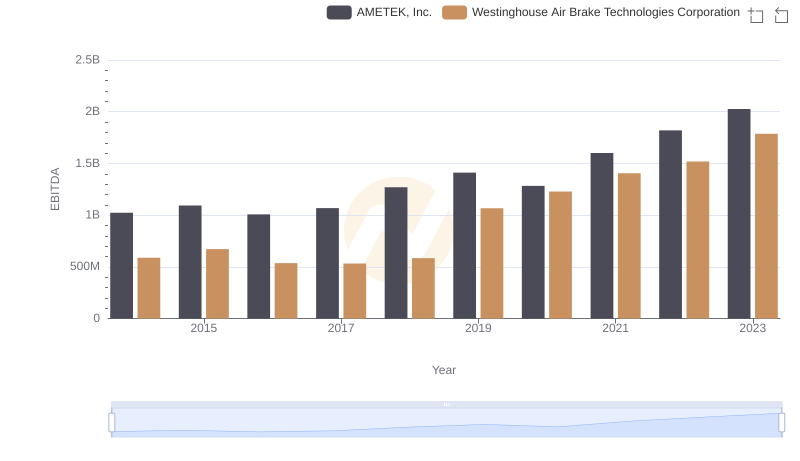
A Professional Review of EBITDA: AMETEK, Inc. Compared to Westinghouse Air Brake Technologies Corporation
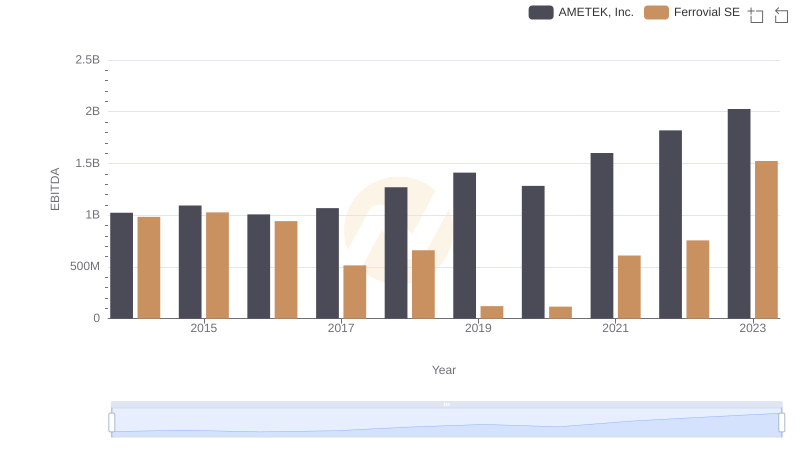
A Side-by-Side Analysis of EBITDA: AMETEK, Inc. and Ferrovial SE
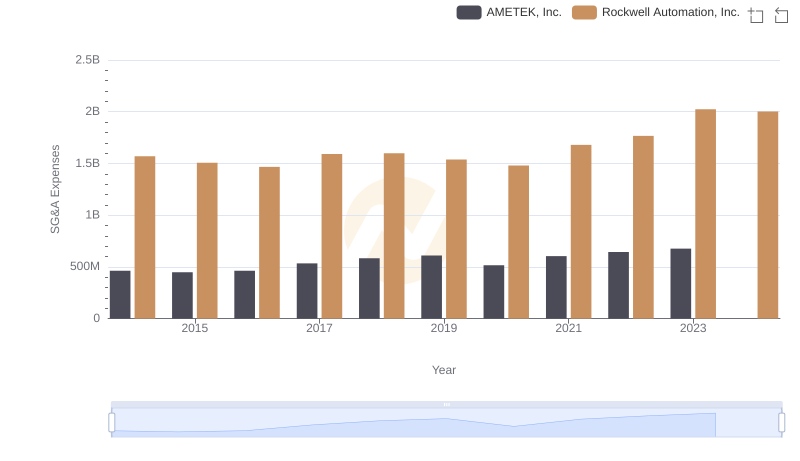
Comparing SG&A Expenses: AMETEK, Inc. vs Rockwell Automation, Inc. Trends and Insights
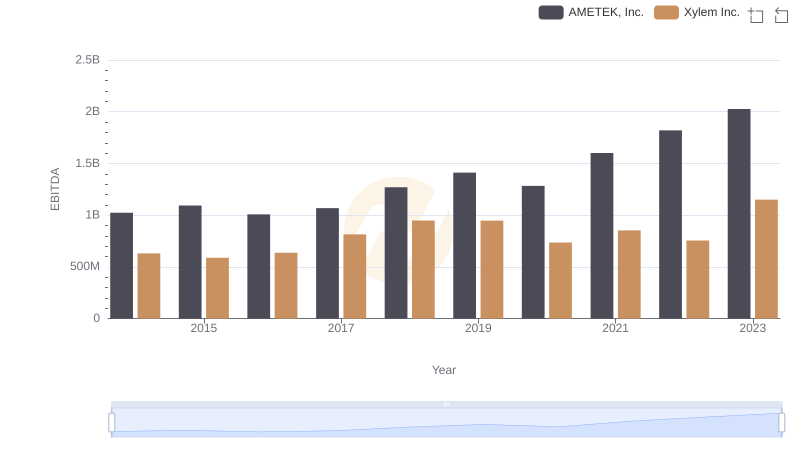
Professional EBITDA Benchmarking: AMETEK, Inc. vs Xylem Inc.
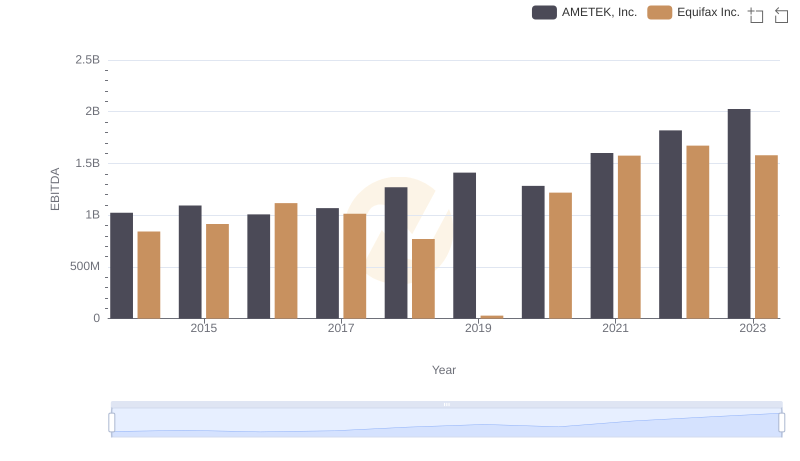
Comparative EBITDA Analysis: AMETEK, Inc. vs Equifax Inc.
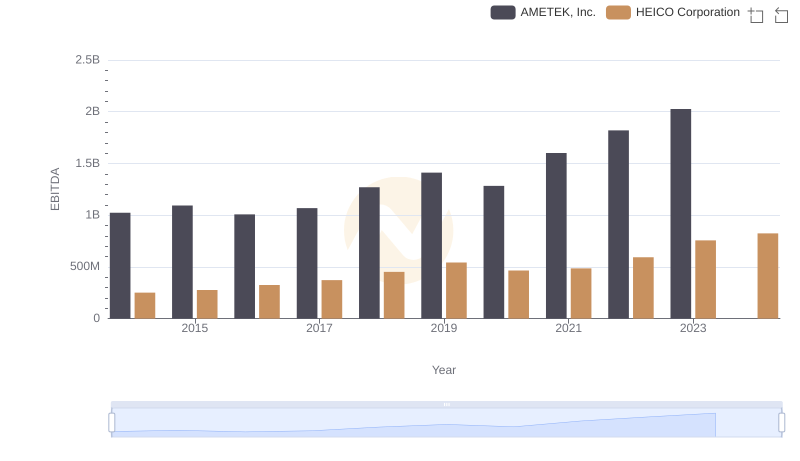
AMETEK, Inc. and HEICO Corporation: A Detailed Examination of EBITDA Performance
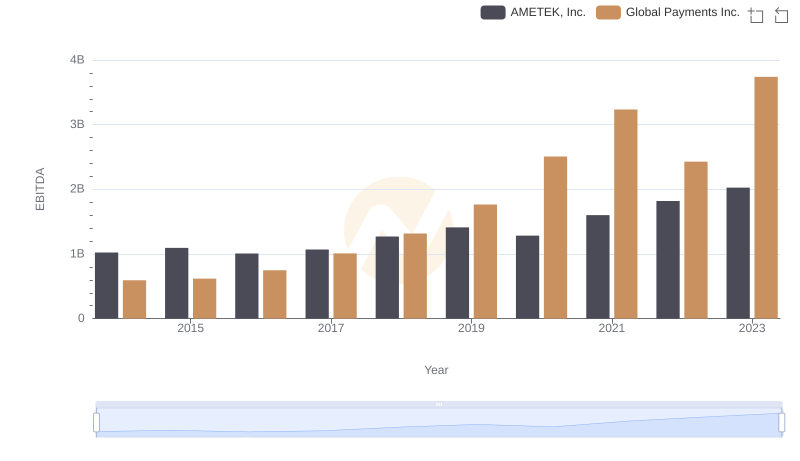
A Side-by-Side Analysis of EBITDA: AMETEK, Inc. and Global Payments Inc.
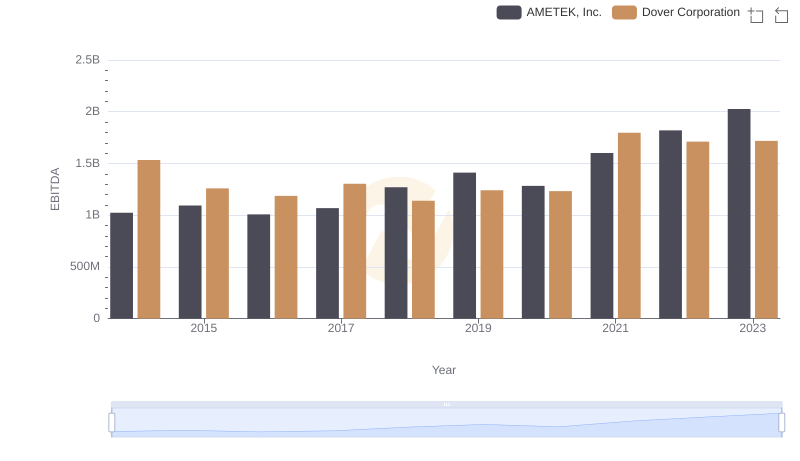
A Professional Review of EBITDA: AMETEK, Inc. Compared to Dover Corporation