| __timestamp | AMETEK, Inc. | Global Payments Inc. |
|---|---|---|
| Wednesday, January 1, 2014 | 1023344000 | 594102000 |
| Thursday, January 1, 2015 | 1093776000 | 618109000 |
| Friday, January 1, 2016 | 1007213000 | 748136000 |
| Sunday, January 1, 2017 | 1068174000 | 1010019000 |
| Monday, January 1, 2018 | 1269415000 | 1315968000 |
| Tuesday, January 1, 2019 | 1411422000 | 1764994000 |
| Wednesday, January 1, 2020 | 1283159000 | 2508393000 |
| Friday, January 1, 2021 | 1600782000 | 3233589000 |
| Saturday, January 1, 2022 | 1820119000 | 2427684000 |
| Sunday, January 1, 2023 | 2025843000 | 3606789000 |
| Monday, January 1, 2024 | 1779562000 | 2333605000 |
Cracking the code
In the ever-evolving landscape of the financial sector, understanding the EBITDA trends of leading companies like AMETEK, Inc. and Global Payments Inc. offers valuable insights. From 2014 to 2023, AMETEK, Inc. demonstrated a steady growth trajectory, with EBITDA increasing by nearly 98%, from approximately $1.02 billion to $2.03 billion. Meanwhile, Global Payments Inc. showcased a more volatile yet impressive growth, with EBITDA surging by over 530%, from around $594 million to $3.74 billion.
This analysis underscores the dynamic nature of the financial industry and the strategic maneuvers companies employ to enhance their market positions.
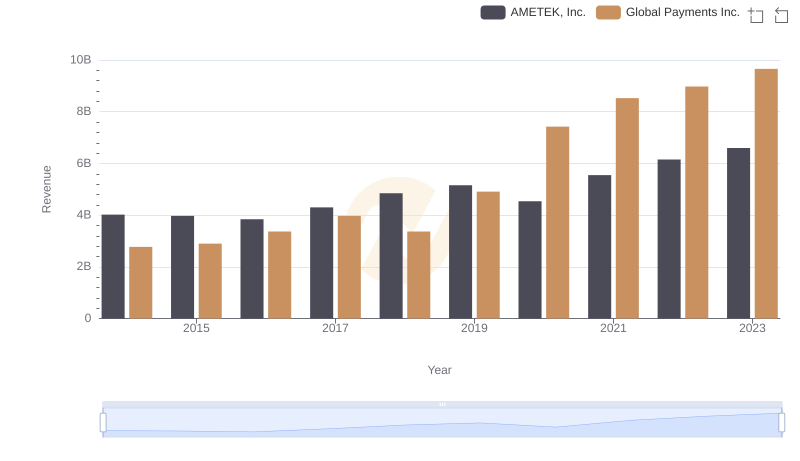
AMETEK, Inc. or Global Payments Inc.: Who Leads in Yearly Revenue?
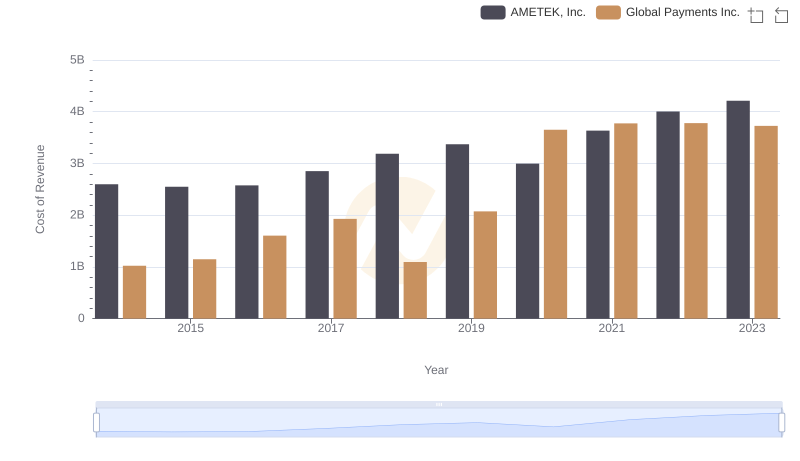
Cost of Revenue Comparison: AMETEK, Inc. vs Global Payments Inc.
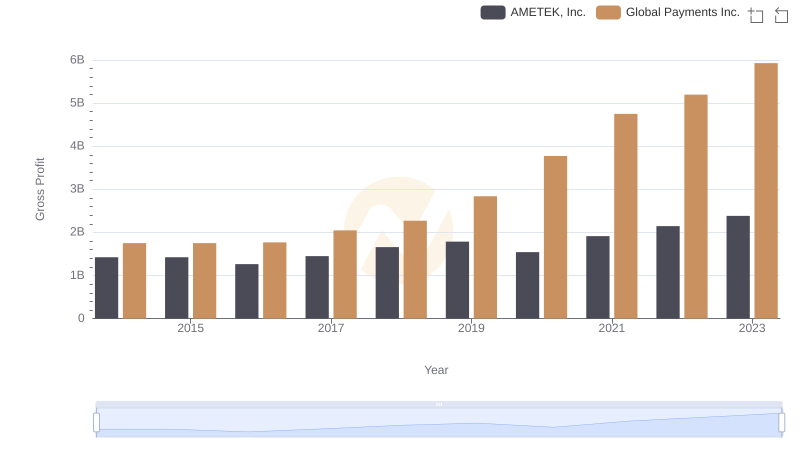
AMETEK, Inc. vs Global Payments Inc.: A Gross Profit Performance Breakdown
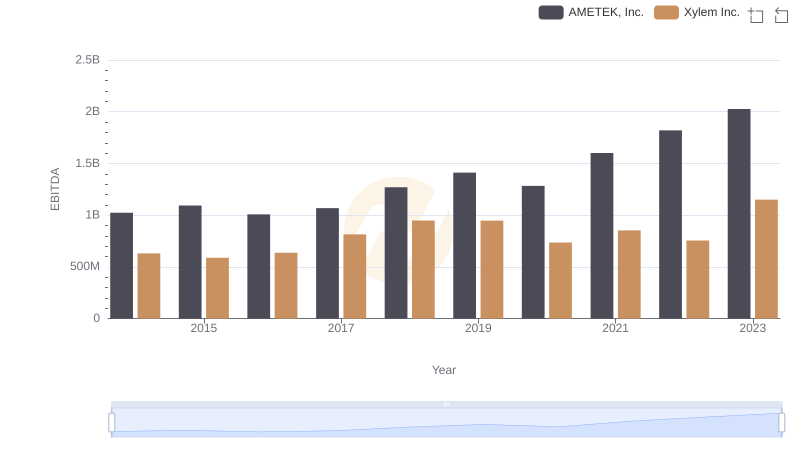
Professional EBITDA Benchmarking: AMETEK, Inc. vs Xylem Inc.
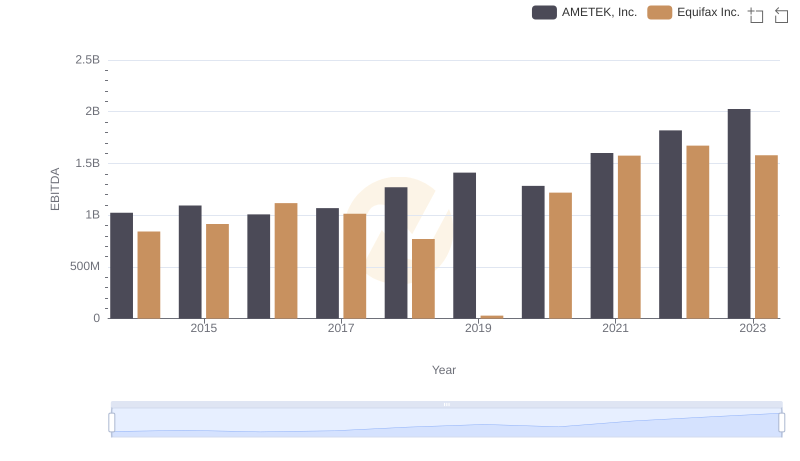
Comparative EBITDA Analysis: AMETEK, Inc. vs Equifax Inc.
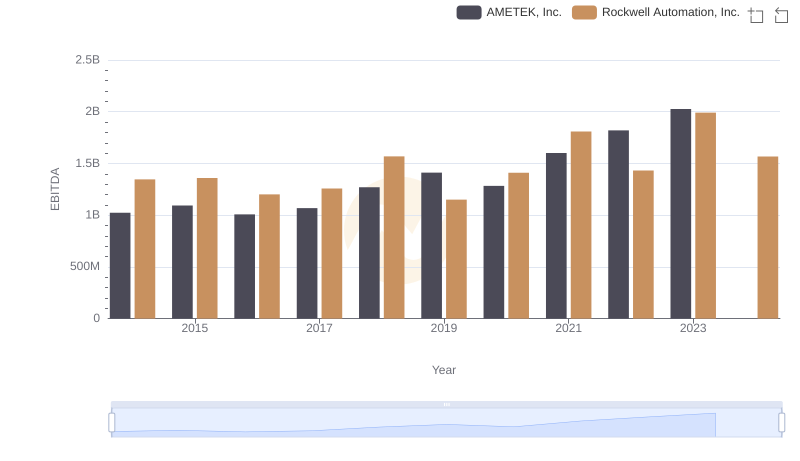
Professional EBITDA Benchmarking: AMETEK, Inc. vs Rockwell Automation, Inc.
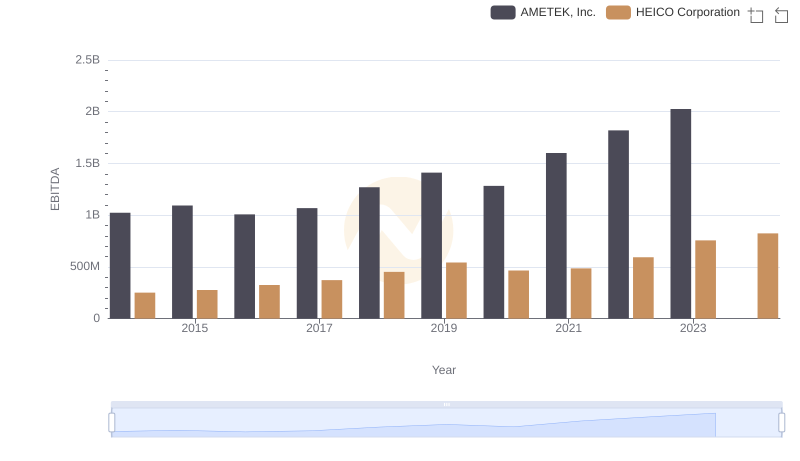
AMETEK, Inc. and HEICO Corporation: A Detailed Examination of EBITDA Performance
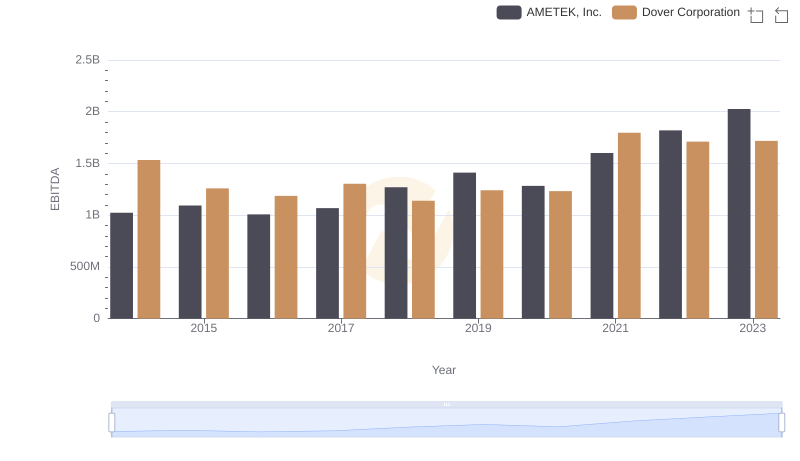
A Professional Review of EBITDA: AMETEK, Inc. Compared to Dover Corporation
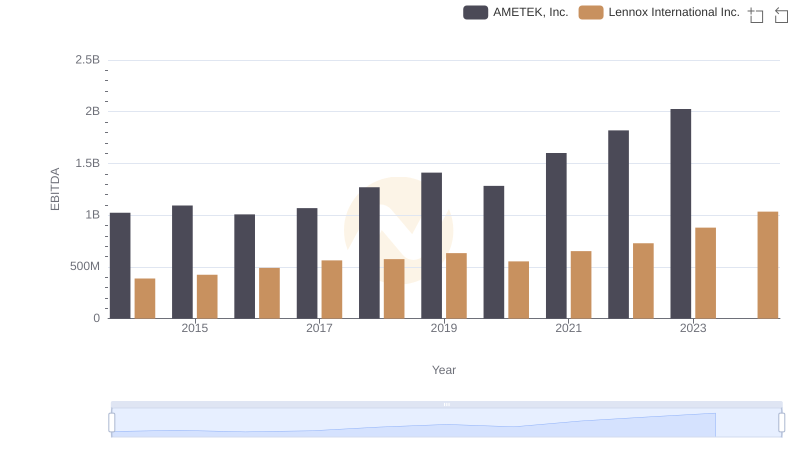
AMETEK, Inc. vs Lennox International Inc.: In-Depth EBITDA Performance Comparison
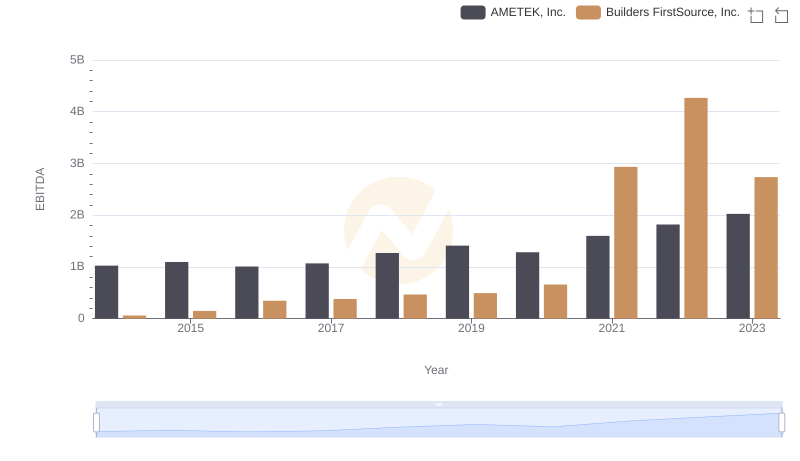
EBITDA Metrics Evaluated: AMETEK, Inc. vs Builders FirstSource, Inc.