| __timestamp | Rockwell Automation, Inc. | Textron Inc. |
|---|---|---|
| Wednesday, January 1, 2014 | 1346000000 | 1575000000 |
| Thursday, January 1, 2015 | 1359100000 | 1601000000 |
| Friday, January 1, 2016 | 1200700000 | 1484000000 |
| Sunday, January 1, 2017 | 1258400000 | 1367000000 |
| Monday, January 1, 2018 | 1568400000 | 1974000000 |
| Tuesday, January 1, 2019 | 1150200000 | 1518000000 |
| Wednesday, January 1, 2020 | 1410200000 | 827000000 |
| Friday, January 1, 2021 | 1808300000 | 1391000000 |
| Saturday, January 1, 2022 | 1432100000 | 1515000000 |
| Sunday, January 1, 2023 | 1990700000 | 1556000000 |
| Monday, January 1, 2024 | 1567500000 | 1422000000 |
In pursuit of knowledge
In the ever-evolving landscape of industrial automation and aerospace, Rockwell Automation, Inc. and Textron Inc. stand as titans. Over the past decade, these companies have showcased fluctuating EBITDA figures, reflecting their strategic maneuvers and market conditions. From 2014 to 2023, Rockwell Automation's EBITDA saw a notable increase of approximately 48%, peaking in 2023. Meanwhile, Textron's EBITDA journey was more volatile, with a significant dip in 2020, but a recovery by 2023. This side-by-side analysis reveals that while both companies faced challenges, Rockwell Automation demonstrated a more consistent upward trend. The data underscores the resilience and adaptability of these industry leaders, offering insights into their financial health and strategic direction. As we look to the future, these trends provide a window into the potential trajectories of these industrial giants.
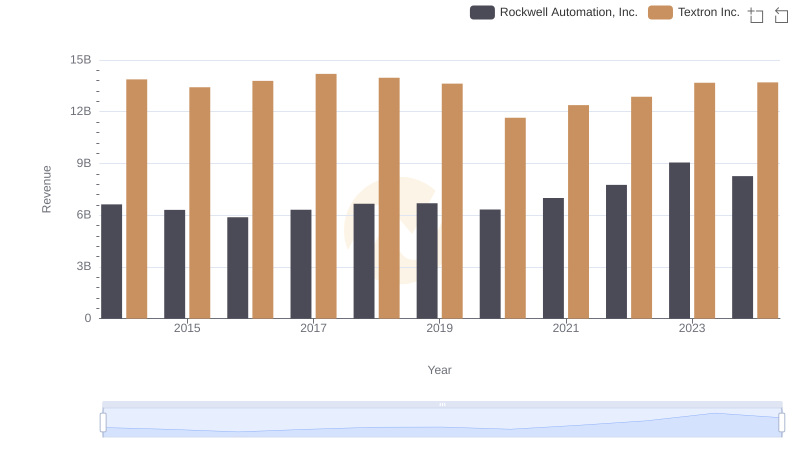
Who Generates More Revenue? Rockwell Automation, Inc. or Textron Inc.
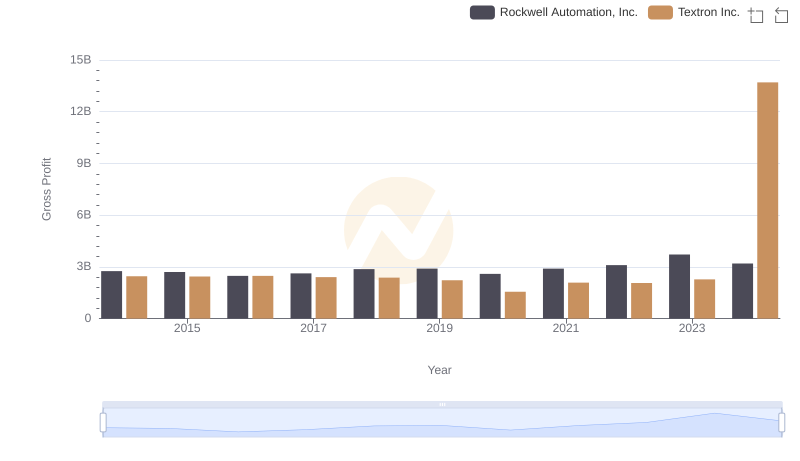
Gross Profit Trends Compared: Rockwell Automation, Inc. vs Textron Inc.
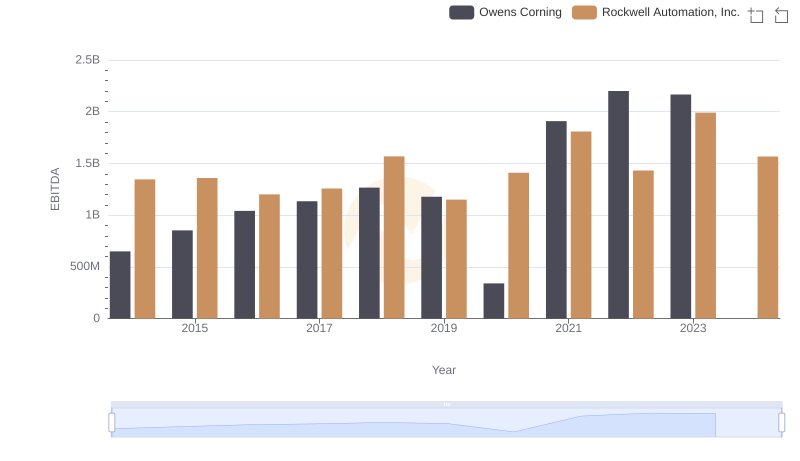
EBITDA Analysis: Evaluating Rockwell Automation, Inc. Against Owens Corning
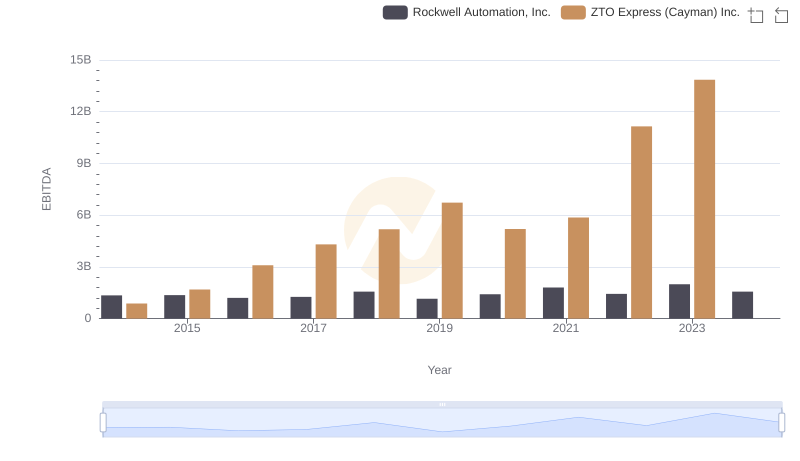
EBITDA Performance Review: Rockwell Automation, Inc. vs ZTO Express (Cayman) Inc.
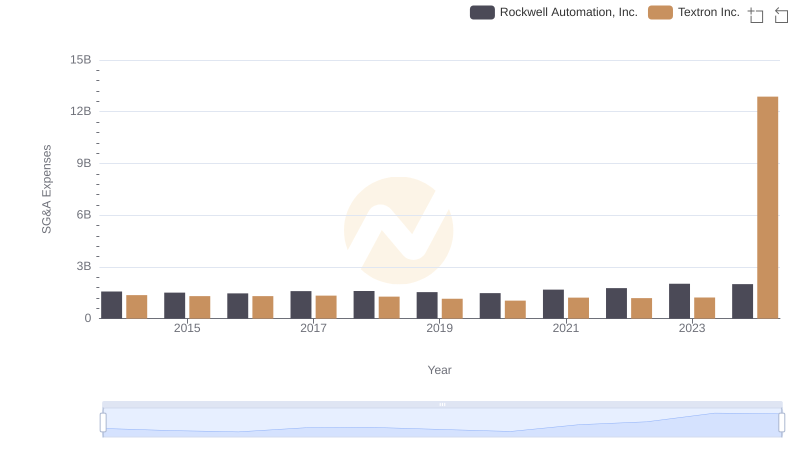
Rockwell Automation, Inc. vs Textron Inc.: SG&A Expense Trends
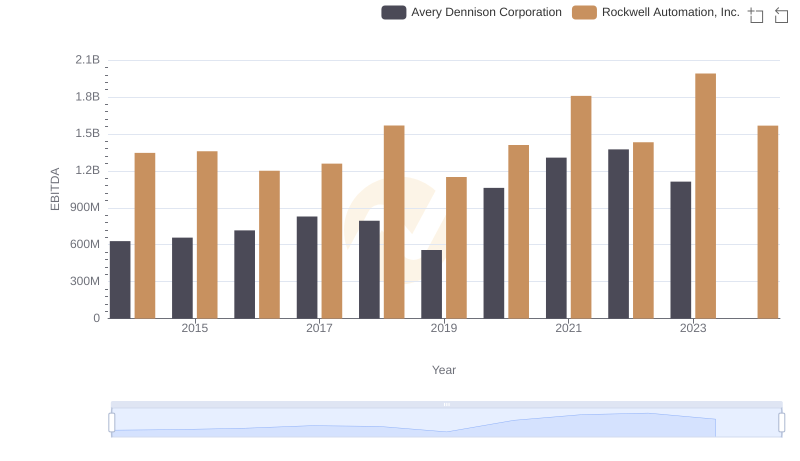
EBITDA Analysis: Evaluating Rockwell Automation, Inc. Against Avery Dennison Corporation

Comparative EBITDA Analysis: Rockwell Automation, Inc. vs AECOM
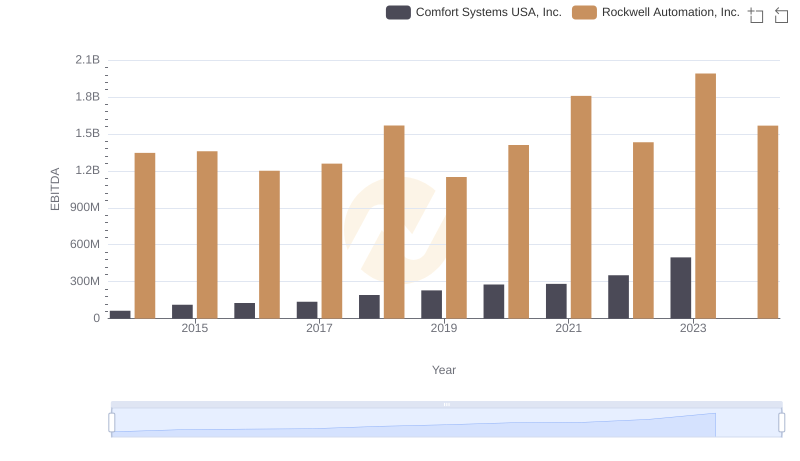
EBITDA Metrics Evaluated: Rockwell Automation, Inc. vs Comfort Systems USA, Inc.
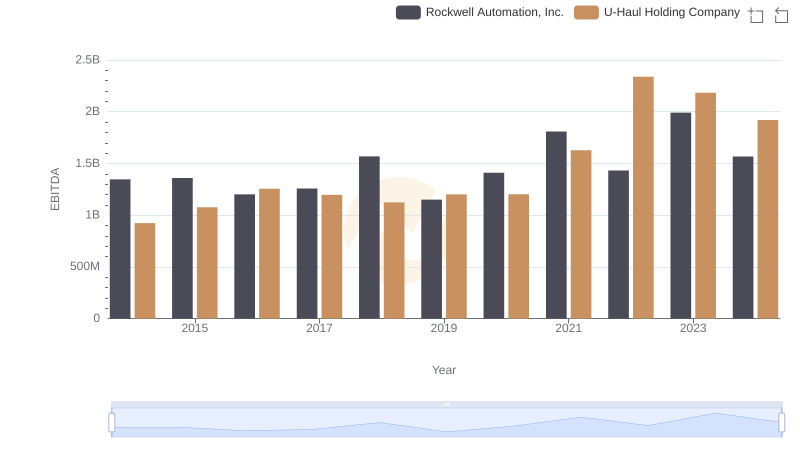
Rockwell Automation, Inc. and U-Haul Holding Company: A Detailed Examination of EBITDA Performance
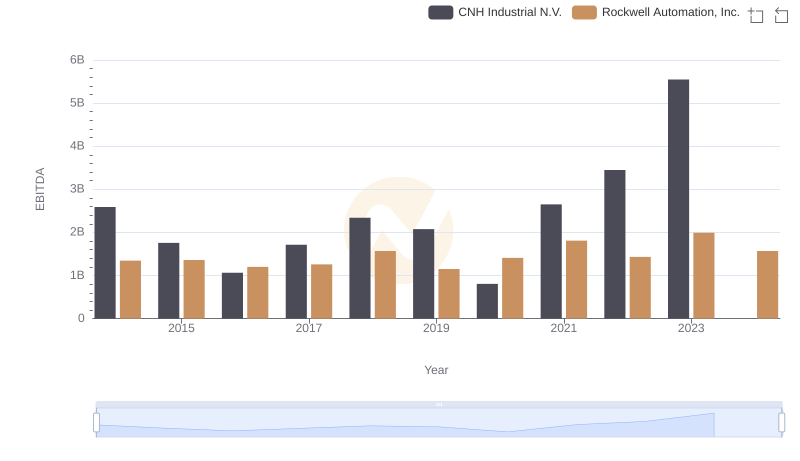
A Side-by-Side Analysis of EBITDA: Rockwell Automation, Inc. and CNH Industrial N.V.