| __timestamp | Rockwell Automation, Inc. | ZTO Express (Cayman) Inc. |
|---|---|---|
| Wednesday, January 1, 2014 | 1346000000 | 876815000 |
| Thursday, January 1, 2015 | 1359100000 | 1687285000 |
| Friday, January 1, 2016 | 1200700000 | 3093956000 |
| Sunday, January 1, 2017 | 1258400000 | 4308801000 |
| Monday, January 1, 2018 | 1568400000 | 5185941000 |
| Tuesday, January 1, 2019 | 1150200000 | 6727397000 |
| Wednesday, January 1, 2020 | 1410200000 | 5197064000 |
| Friday, January 1, 2021 | 1808300000 | 5866901000 |
| Saturday, January 1, 2022 | 1432100000 | 11147519000 |
| Sunday, January 1, 2023 | 1990700000 | 13853443000 |
| Monday, January 1, 2024 | 1567500000 |
Infusing magic into the data realm
In the ever-evolving landscape of global business, Rockwell Automation, Inc. and ZTO Express (Cayman) Inc. present a fascinating study in contrasts. Over the past decade, Rockwell Automation has shown a steady EBITDA growth, peaking in 2023 with a 36% increase from its 2014 figures. Meanwhile, ZTO Express has experienced a meteoric rise, with its EBITDA surging by over 1,400% from 2014 to 2023, reflecting its rapid expansion in the logistics sector.
From 2014 to 2023, Rockwell Automation's EBITDA fluctuated, with a notable dip in 2019, but rebounded strongly by 2023. In contrast, ZTO Express's EBITDA growth was more volatile, yet consistently upward, highlighting its aggressive market capture strategy. The absence of data for ZTO in 2024 suggests a potential shift or reporting delay, warranting close observation.
This comparative analysis underscores the diverse strategies and market dynamics shaping these industry leaders.
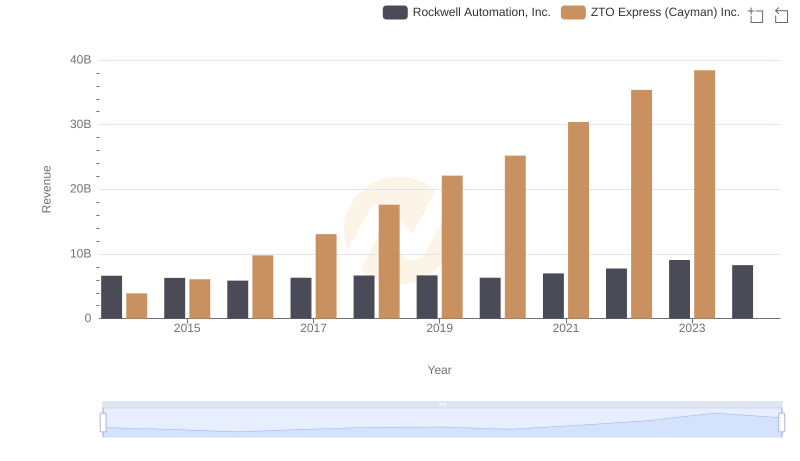
Rockwell Automation, Inc. vs ZTO Express (Cayman) Inc.: Annual Revenue Growth Compared

Rockwell Automation, Inc. vs ZTO Express (Cayman) Inc.: Efficiency in Cost of Revenue Explored
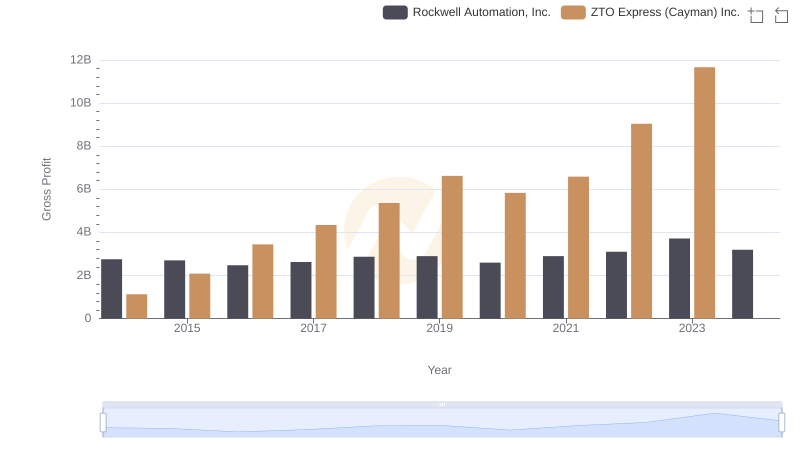
Key Insights on Gross Profit: Rockwell Automation, Inc. vs ZTO Express (Cayman) Inc.
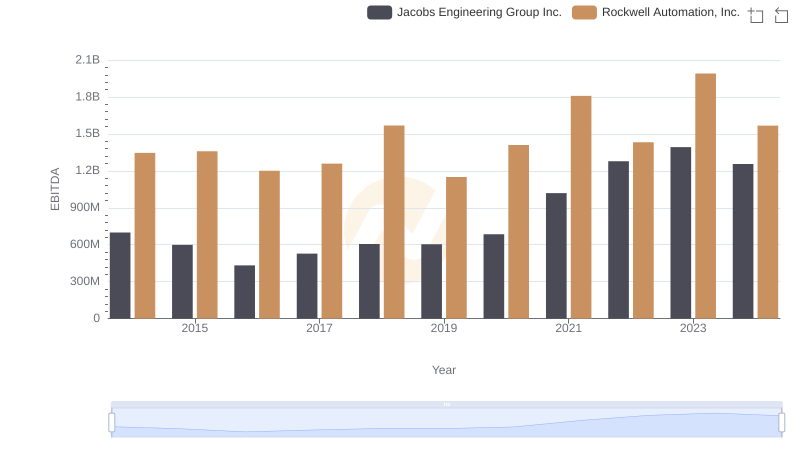
Rockwell Automation, Inc. vs Jacobs Engineering Group Inc.: In-Depth EBITDA Performance Comparison

Comprehensive EBITDA Comparison: Rockwell Automation, Inc. vs XPO Logistics, Inc.

A Professional Review of EBITDA: Rockwell Automation, Inc. Compared to Expeditors International of Washington, Inc.
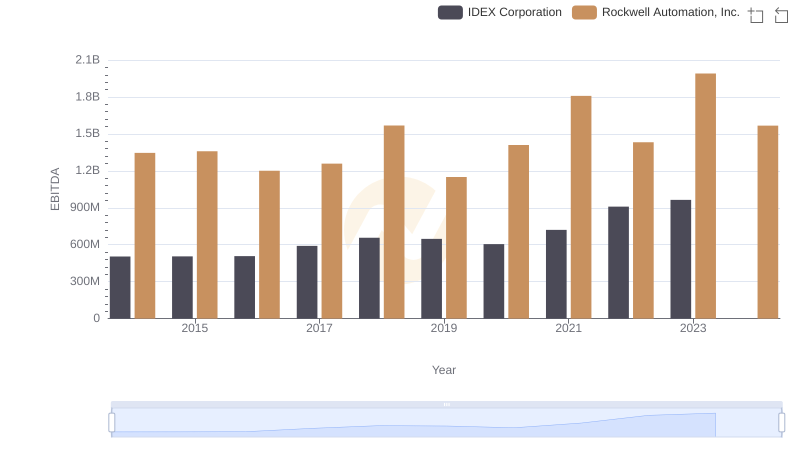
Rockwell Automation, Inc. vs IDEX Corporation: In-Depth EBITDA Performance Comparison
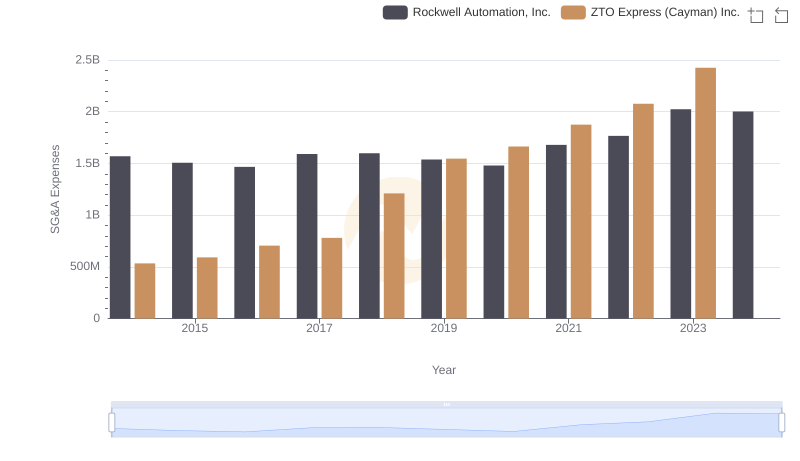
Who Optimizes SG&A Costs Better? Rockwell Automation, Inc. or ZTO Express (Cayman) Inc.
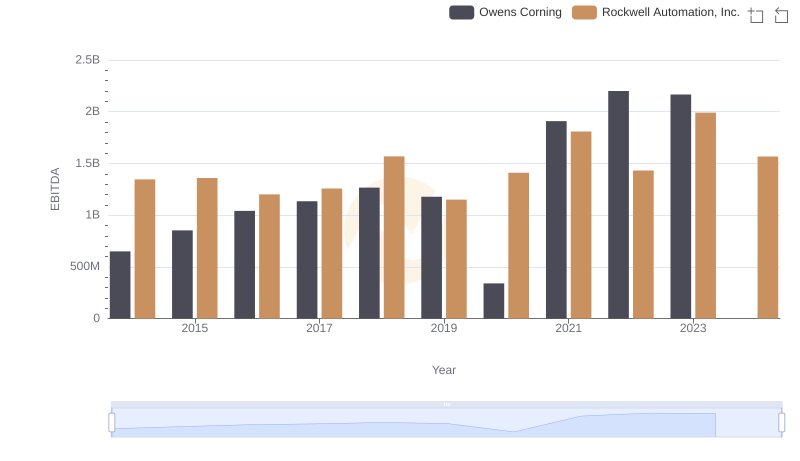
EBITDA Analysis: Evaluating Rockwell Automation, Inc. Against Owens Corning
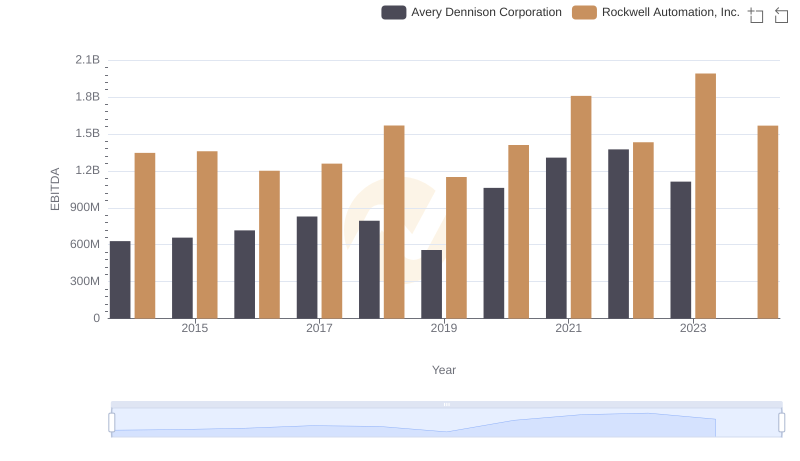
EBITDA Analysis: Evaluating Rockwell Automation, Inc. Against Avery Dennison Corporation
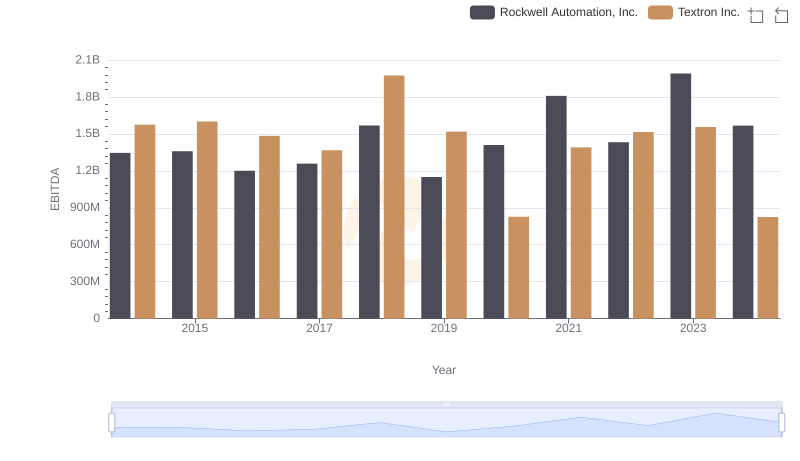
A Side-by-Side Analysis of EBITDA: Rockwell Automation, Inc. and Textron Inc.