| __timestamp | Owens Corning | Rockwell Automation, Inc. |
|---|---|---|
| Wednesday, January 1, 2014 | 650000000 | 1346000000 |
| Thursday, January 1, 2015 | 853000000 | 1359100000 |
| Friday, January 1, 2016 | 1041000000 | 1200700000 |
| Sunday, January 1, 2017 | 1134000000 | 1258400000 |
| Monday, January 1, 2018 | 1266000000 | 1568400000 |
| Tuesday, January 1, 2019 | 1178000000 | 1150200000 |
| Wednesday, January 1, 2020 | 341000000 | 1410200000 |
| Friday, January 1, 2021 | 1909000000 | 1808300000 |
| Saturday, January 1, 2022 | 2200000000 | 1432100000 |
| Sunday, January 1, 2023 | 2166000000 | 1990700000 |
| Monday, January 1, 2024 | 1567500000 |
Unveiling the hidden dimensions of data
In the ever-evolving landscape of industrial automation and building materials, Rockwell Automation and Owens Corning stand as titans. From 2014 to 2023, these companies have showcased intriguing trends in their EBITDA, a key indicator of financial health. Rockwell Automation consistently outperformed Owens Corning, with an average EBITDA of approximately $1.46 billion, peaking in 2023 with a 36% increase from 2014. Owens Corning, while trailing, demonstrated remarkable growth, with a 233% surge in EBITDA from 2014 to 2022, before slightly dipping in 2023. Notably, 2020 marked a challenging year for Owens Corning, with EBITDA plummeting to $341 million, reflecting broader economic disruptions. As we look to 2024, Rockwell Automation's data remains robust, while Owens Corning's figures are yet to be revealed, leaving room for speculation and anticipation.
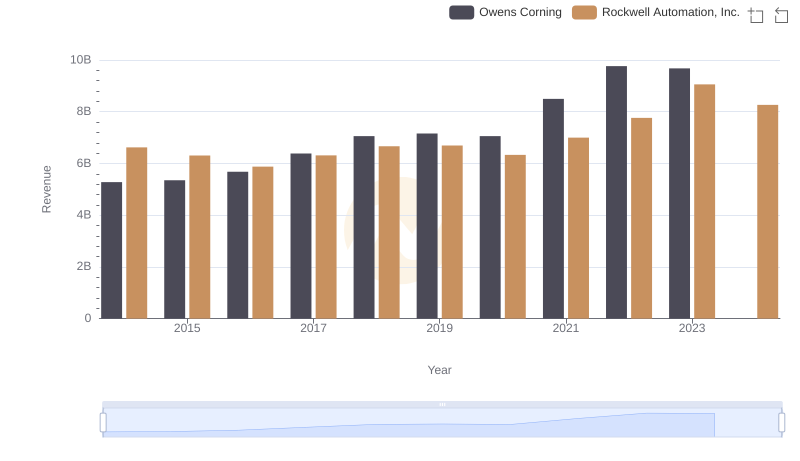
Who Generates More Revenue? Rockwell Automation, Inc. or Owens Corning
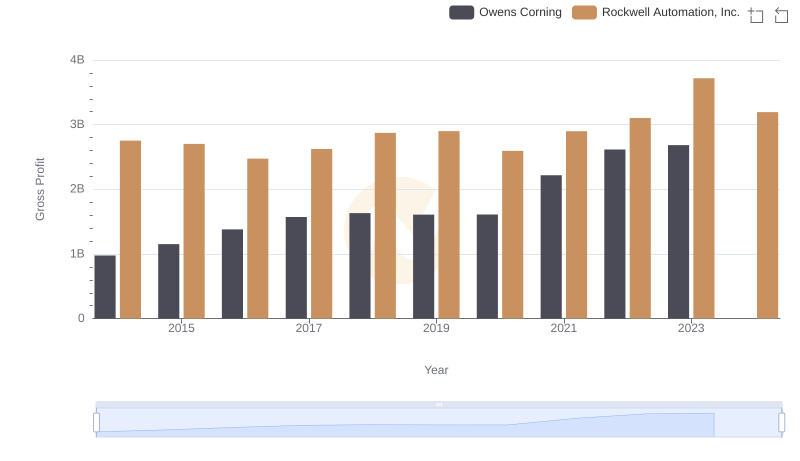
Gross Profit Trends Compared: Rockwell Automation, Inc. vs Owens Corning
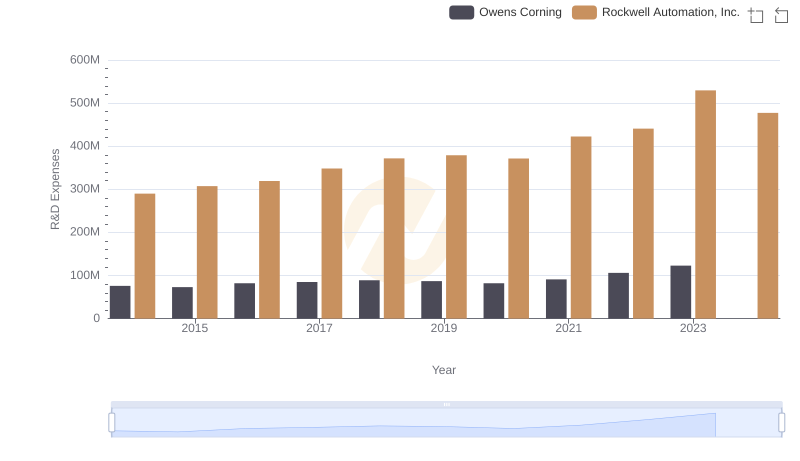
R&D Spending Showdown: Rockwell Automation, Inc. vs Owens Corning
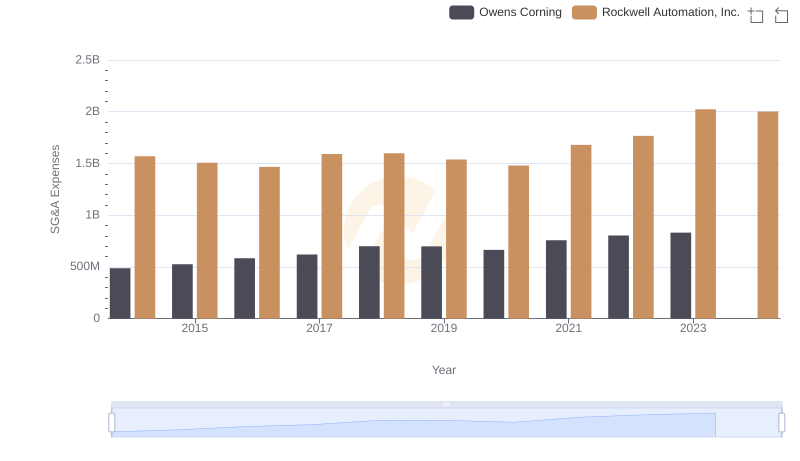
Operational Costs Compared: SG&A Analysis of Rockwell Automation, Inc. and Owens Corning
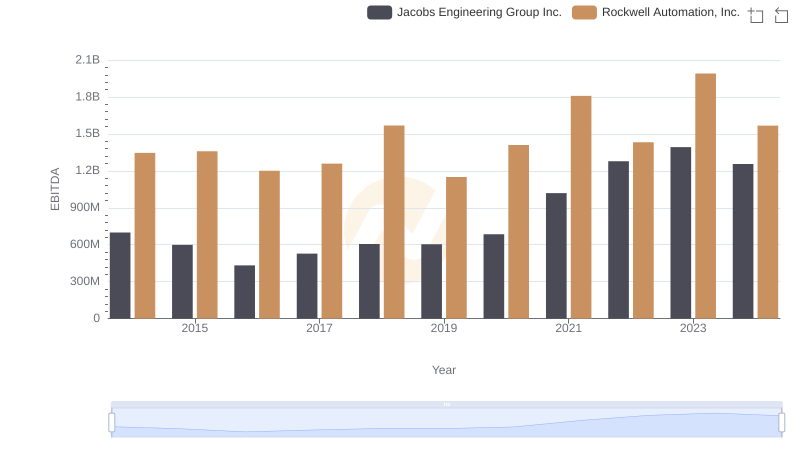
Rockwell Automation, Inc. vs Jacobs Engineering Group Inc.: In-Depth EBITDA Performance Comparison

Comprehensive EBITDA Comparison: Rockwell Automation, Inc. vs XPO Logistics, Inc.

A Professional Review of EBITDA: Rockwell Automation, Inc. Compared to Expeditors International of Washington, Inc.
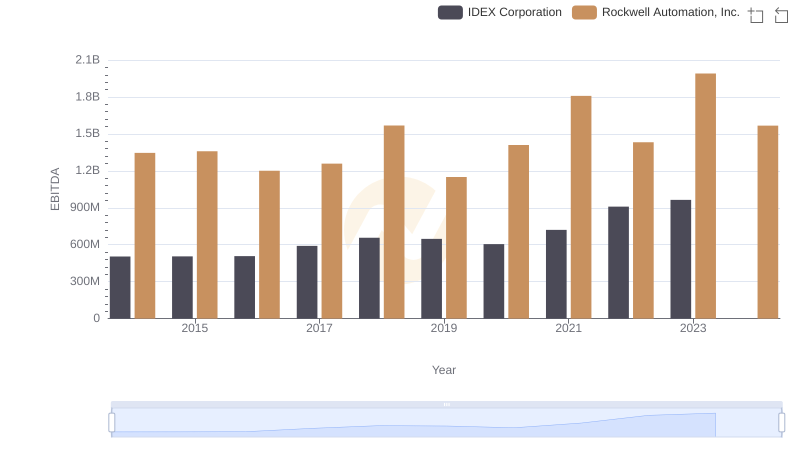
Rockwell Automation, Inc. vs IDEX Corporation: In-Depth EBITDA Performance Comparison
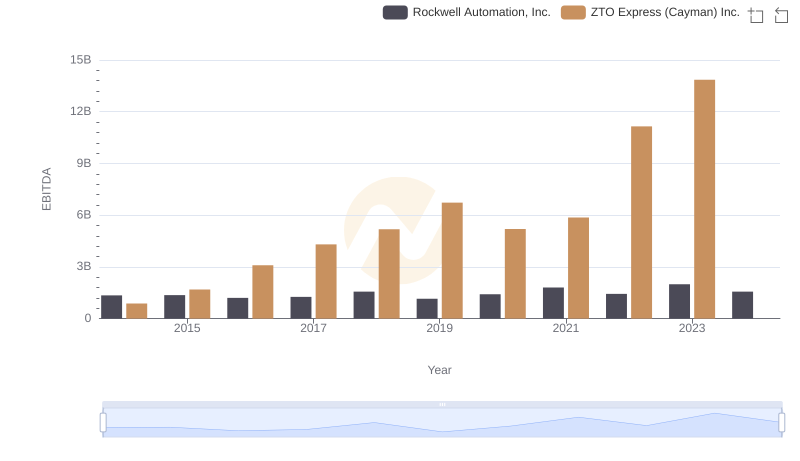
EBITDA Performance Review: Rockwell Automation, Inc. vs ZTO Express (Cayman) Inc.
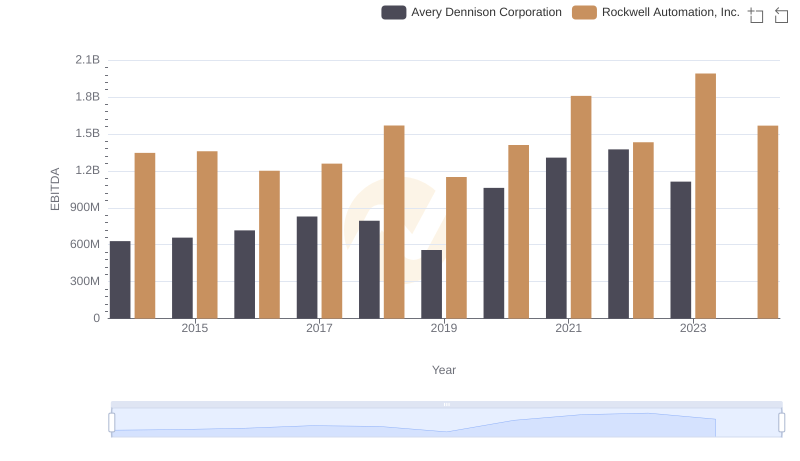
EBITDA Analysis: Evaluating Rockwell Automation, Inc. Against Avery Dennison Corporation