| __timestamp | Northrop Grumman Corporation | Parker-Hannifin Corporation |
|---|---|---|
| Wednesday, January 1, 2014 | 23979000000 | 13215971000 |
| Thursday, January 1, 2015 | 23526000000 | 12711744000 |
| Friday, January 1, 2016 | 24508000000 | 11360753000 |
| Sunday, January 1, 2017 | 25803000000 | 12029312000 |
| Monday, January 1, 2018 | 30095000000 | 14302392000 |
| Tuesday, January 1, 2019 | 33841000000 | 14320324000 |
| Wednesday, January 1, 2020 | 36799000000 | 13695520000 |
| Friday, January 1, 2021 | 35667000000 | 14347640000 |
| Saturday, January 1, 2022 | 36602000000 | 15861608000 |
| Sunday, January 1, 2023 | 39290000000 | 19065194000 |
| Monday, January 1, 2024 | 41033000000 | 19929606000 |
Unveiling the hidden dimensions of data
In the competitive landscape of the industrial and defense sectors, Parker-Hannifin Corporation and Northrop Grumman Corporation have showcased remarkable revenue trajectories over the past decade. From 2014 to 2023, Northrop Grumman's revenue surged by approximately 64%, reflecting its robust position in the defense industry. Meanwhile, Parker-Hannifin, a leader in motion and control technologies, experienced a steady growth of around 44% during the same period.
Northrop Grumman's revenue growth was particularly notable between 2018 and 2023, with a consistent upward trend, peaking in 2023. Parker-Hannifin, on the other hand, demonstrated resilience with a significant jump in 2023, marking its highest revenue year. The data for 2024 is incomplete, but Parker-Hannifin's trajectory suggests continued growth. These insights highlight the dynamic nature of these industries and the strategic maneuvers of these corporations.
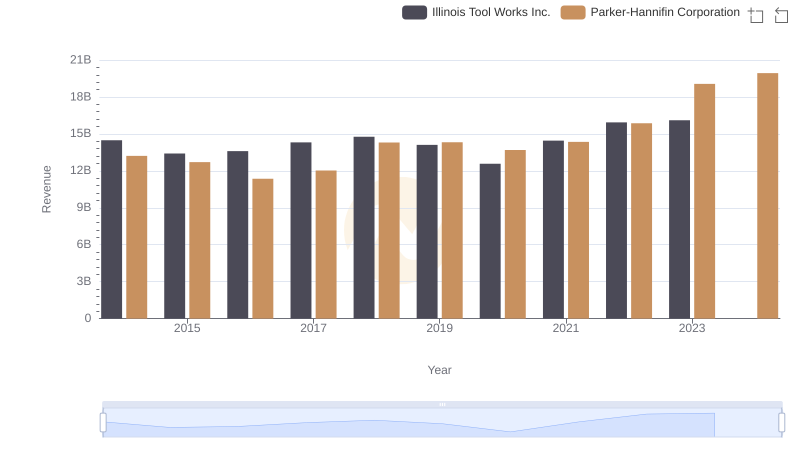
Parker-Hannifin Corporation and Illinois Tool Works Inc.: A Comprehensive Revenue Analysis

Who Generates More Revenue? Parker-Hannifin Corporation or TransDigm Group Incorporated
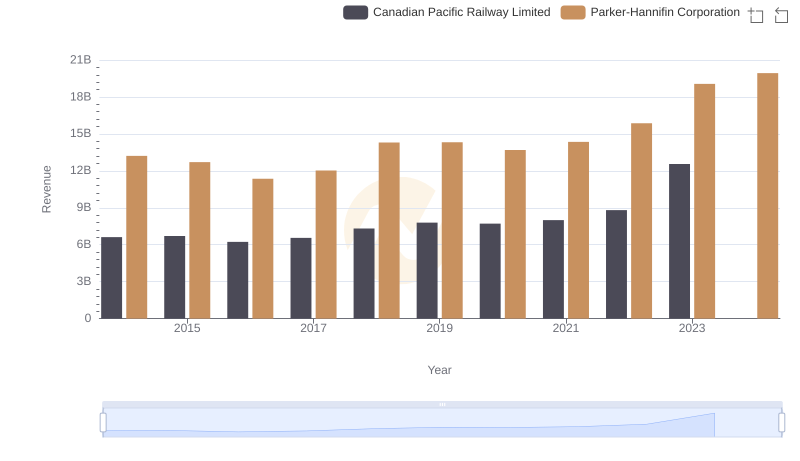
Comparing Revenue Performance: Parker-Hannifin Corporation or Canadian Pacific Railway Limited?
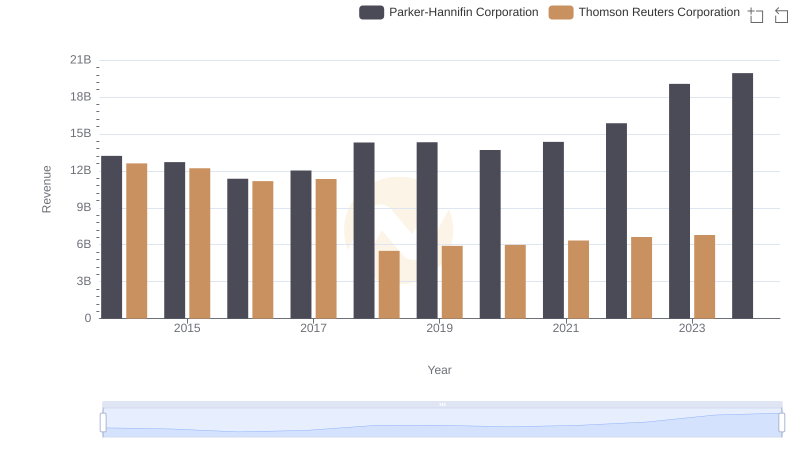
Breaking Down Revenue Trends: Parker-Hannifin Corporation vs Thomson Reuters Corporation
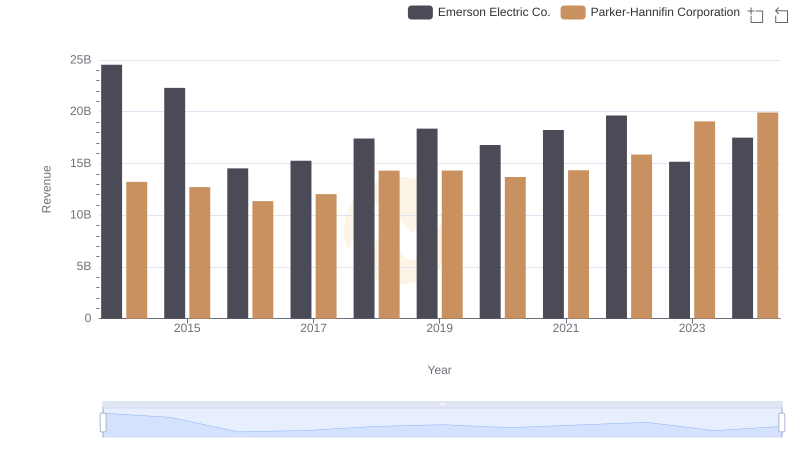
Revenue Showdown: Parker-Hannifin Corporation vs Emerson Electric Co.
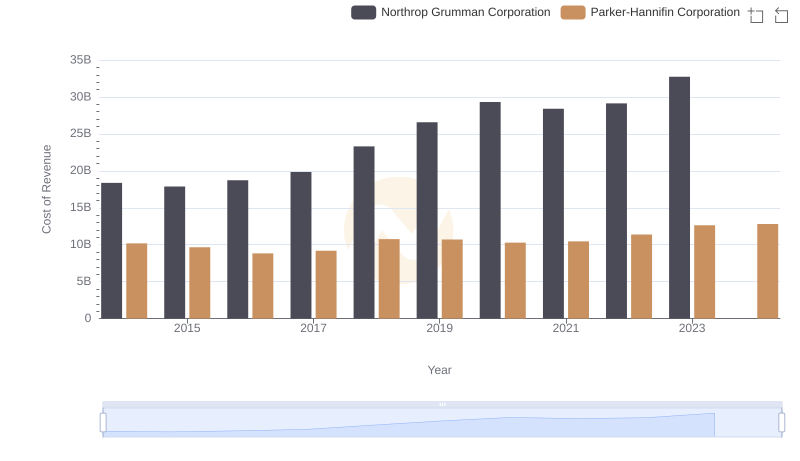
Cost Insights: Breaking Down Parker-Hannifin Corporation and Northrop Grumman Corporation's Expenses
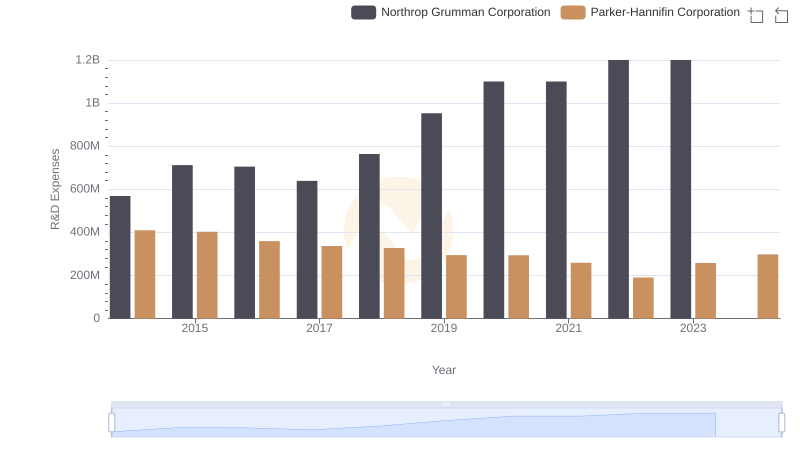
R&D Insights: How Parker-Hannifin Corporation and Northrop Grumman Corporation Allocate Funds
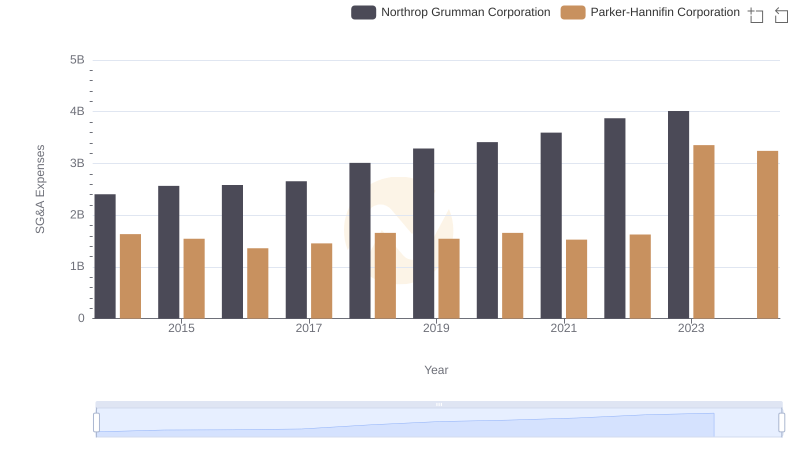
SG&A Efficiency Analysis: Comparing Parker-Hannifin Corporation and Northrop Grumman Corporation
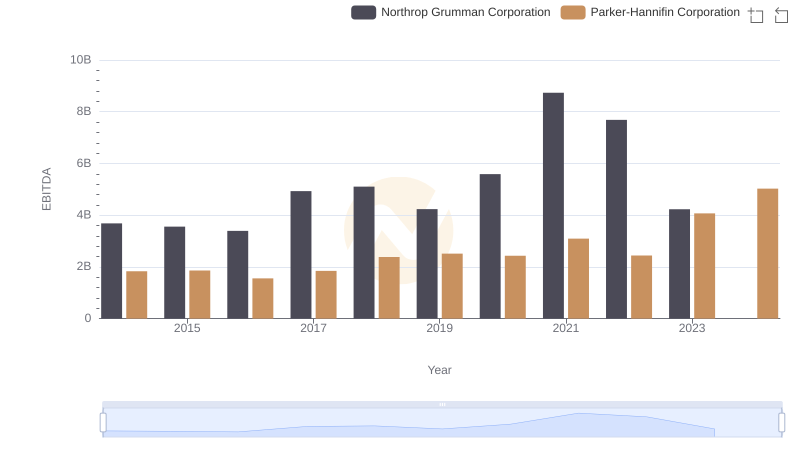
A Side-by-Side Analysis of EBITDA: Parker-Hannifin Corporation and Northrop Grumman Corporation