| __timestamp | Northrop Grumman Corporation | Parker-Hannifin Corporation |
|---|---|---|
| Wednesday, January 1, 2014 | 18378000000 | 10188227000 |
| Thursday, January 1, 2015 | 17884000000 | 9655245000 |
| Friday, January 1, 2016 | 18731000000 | 8823384000 |
| Sunday, January 1, 2017 | 19849000000 | 9188962000 |
| Monday, January 1, 2018 | 23304000000 | 10762841000 |
| Tuesday, January 1, 2019 | 26582000000 | 10703484000 |
| Wednesday, January 1, 2020 | 29321000000 | 10286518000 |
| Friday, January 1, 2021 | 28399000000 | 10449680000 |
| Saturday, January 1, 2022 | 29128000000 | 11387267000 |
| Sunday, January 1, 2023 | 32739000000 | 12635892000 |
| Monday, January 1, 2024 | 32671000000 | 12801816000 |
Infusing magic into the data realm
In the ever-evolving landscape of industrial and defense sectors, understanding cost structures is pivotal. Parker-Hannifin Corporation, a leader in motion and control technologies, and Northrop Grumman Corporation, a giant in aerospace and defense, offer intriguing insights into their financial strategies over the past decade.
From 2014 to 2023, Northrop Grumman's cost of revenue surged by approximately 78%, peaking in 2023. This reflects a strategic expansion in defense capabilities, aligning with global security demands. In contrast, Parker-Hannifin's cost of revenue increased by about 24% over the same period, indicating steady growth in its industrial operations.
While Parker-Hannifin's 2024 data is available, Northrop Grumman's is notably absent, leaving room for speculation on future financial maneuvers. This gap highlights the dynamic nature of these industries and the importance of continuous monitoring.
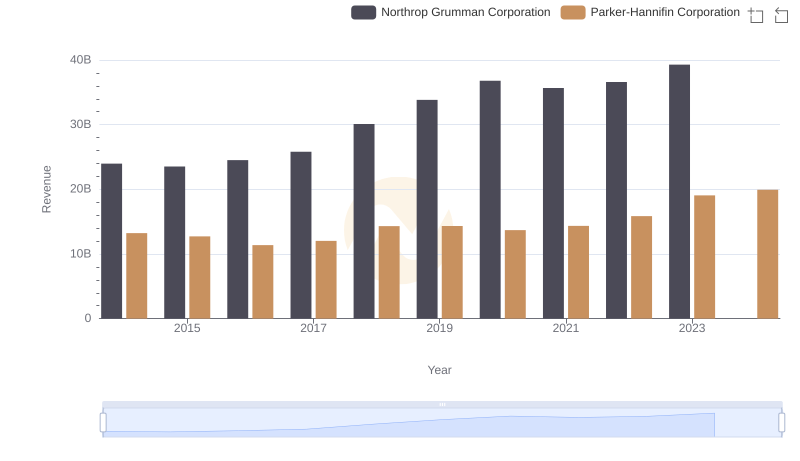
Revenue Insights: Parker-Hannifin Corporation and Northrop Grumman Corporation Performance Compared
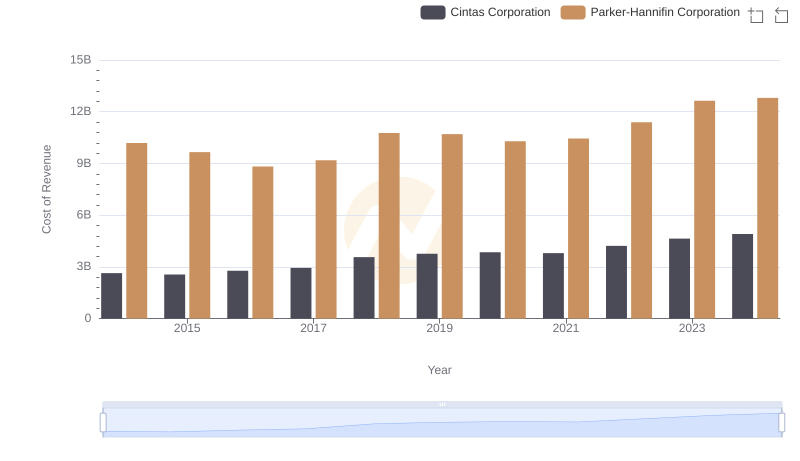
Cost Insights: Breaking Down Parker-Hannifin Corporation and Cintas Corporation's Expenses
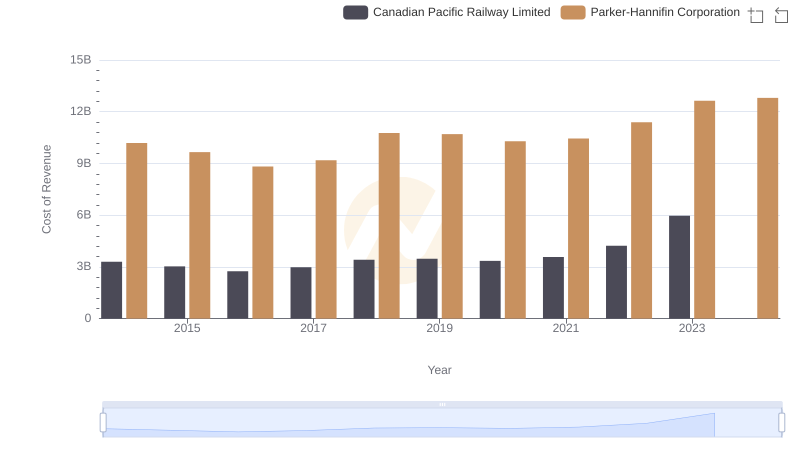
Cost of Revenue Trends: Parker-Hannifin Corporation vs Canadian Pacific Railway Limited
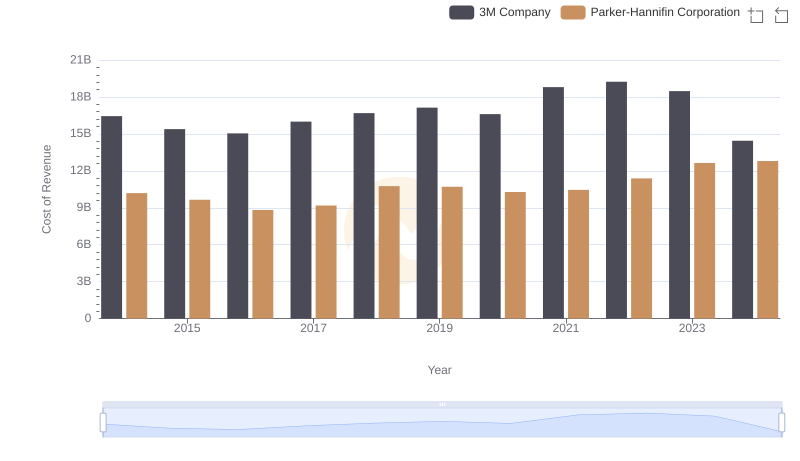
Parker-Hannifin Corporation vs 3M Company: Efficiency in Cost of Revenue Explored

Cost of Revenue Trends: Parker-Hannifin Corporation vs Illinois Tool Works Inc.
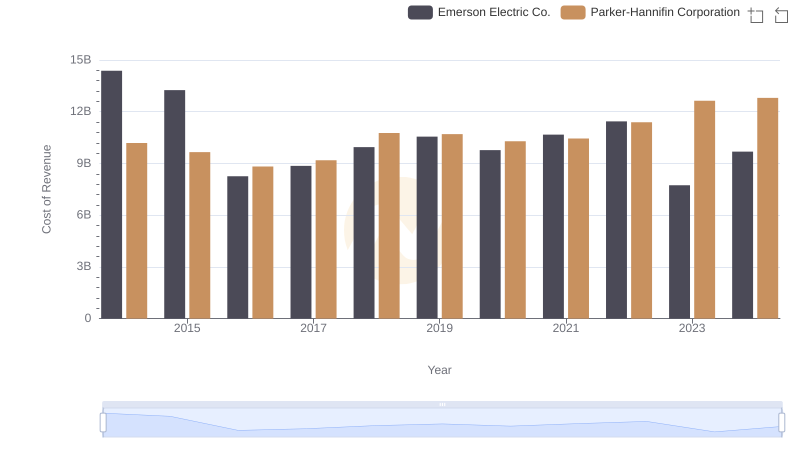
Comparing Cost of Revenue Efficiency: Parker-Hannifin Corporation vs Emerson Electric Co.
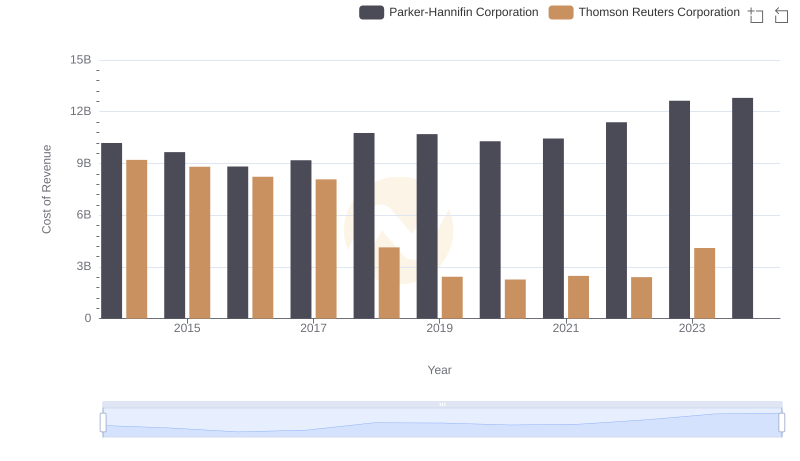
Comparing Cost of Revenue Efficiency: Parker-Hannifin Corporation vs Thomson Reuters Corporation
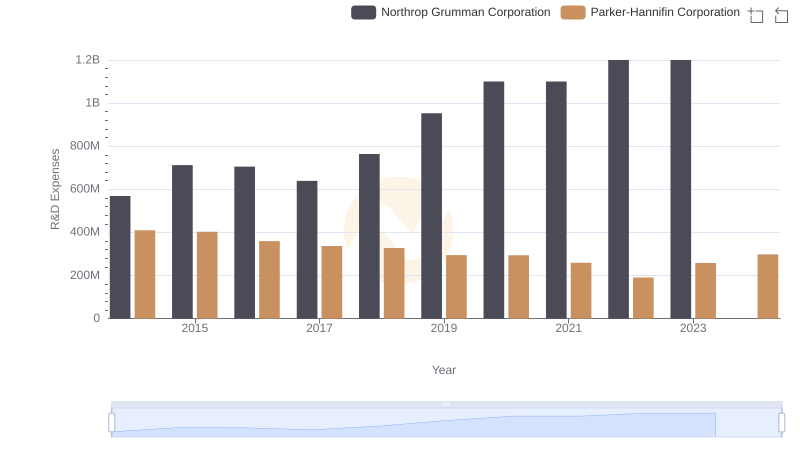
R&D Insights: How Parker-Hannifin Corporation and Northrop Grumman Corporation Allocate Funds
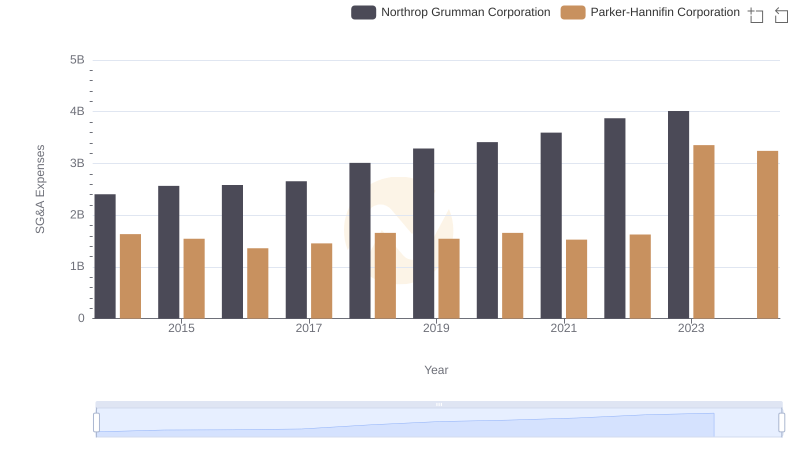
SG&A Efficiency Analysis: Comparing Parker-Hannifin Corporation and Northrop Grumman Corporation
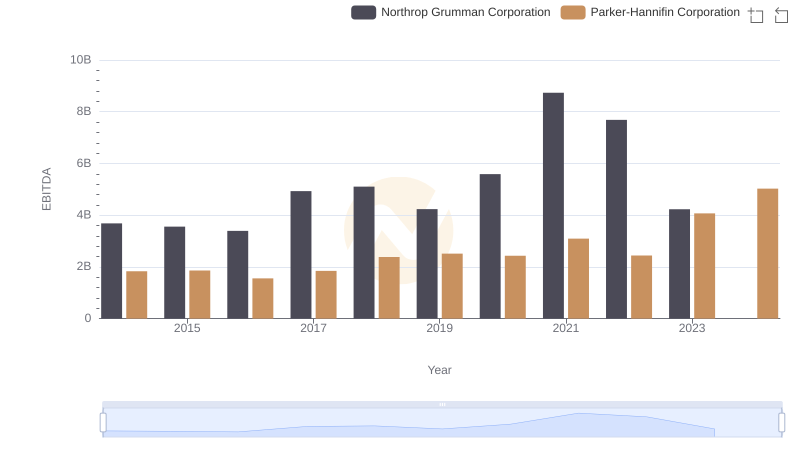
A Side-by-Side Analysis of EBITDA: Parker-Hannifin Corporation and Northrop Grumman Corporation