| __timestamp | Parker-Hannifin Corporation | Thomson Reuters Corporation |
|---|---|---|
| Wednesday, January 1, 2014 | 1832903000 | 4289000000 |
| Thursday, January 1, 2015 | 1861551000 | 3151000000 |
| Friday, January 1, 2016 | 1558088000 | 2999000000 |
| Sunday, January 1, 2017 | 1846306000 | 1495930891 |
| Monday, January 1, 2018 | 2382235000 | 1345686008 |
| Tuesday, January 1, 2019 | 2513468000 | 1913474675 |
| Wednesday, January 1, 2020 | 2431500000 | 2757000000 |
| Friday, January 1, 2021 | 3092383000 | 1994296441 |
| Saturday, January 1, 2022 | 2441242000 | 3010000000 |
| Sunday, January 1, 2023 | 4071687000 | 2950000000 |
| Monday, January 1, 2024 | 5028229000 |
Unveiling the hidden dimensions of data
In the ever-evolving landscape of global business, Parker-Hannifin Corporation and Thomson Reuters Corporation stand as titans in their respective fields. From 2014 to 2023, Parker-Hannifin's EBITDA surged by an impressive 175%, peaking in 2023. This growth reflects the company's strategic innovations and robust market positioning. In contrast, Thomson Reuters experienced a more volatile EBITDA trajectory, with a notable dip in 2018, followed by a recovery to 3.01 billion in 2022. However, data for 2024 remains elusive, leaving room for speculation on future performance.
This comparison highlights the dynamic nature of corporate performance and the strategic maneuvers that define industry leaders.
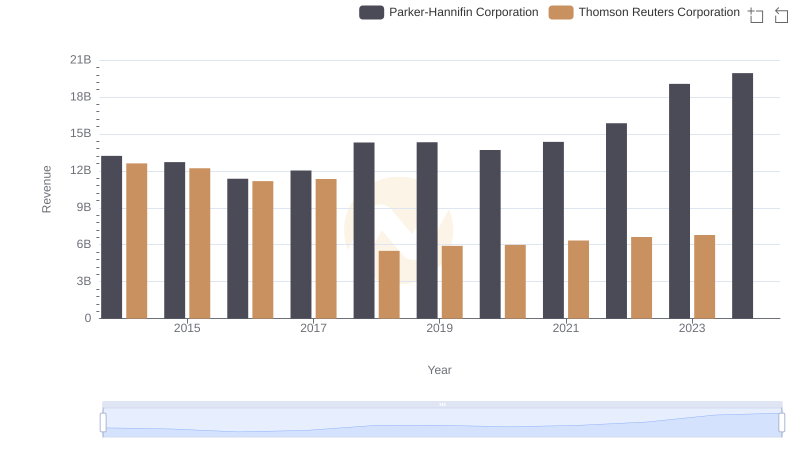
Breaking Down Revenue Trends: Parker-Hannifin Corporation vs Thomson Reuters Corporation
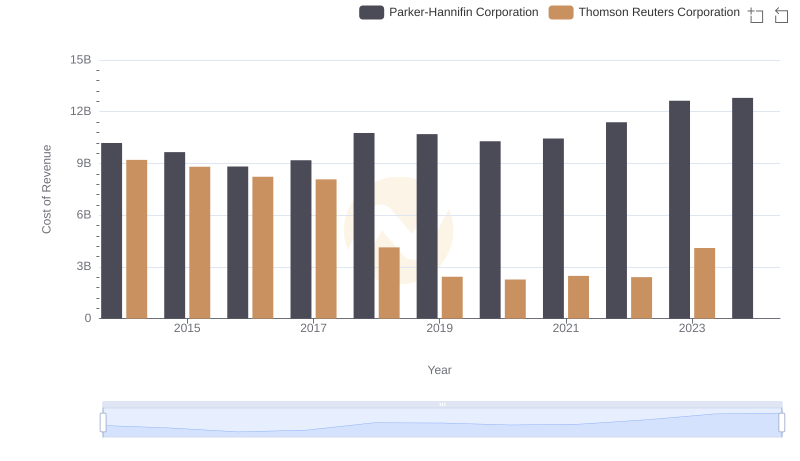
Comparing Cost of Revenue Efficiency: Parker-Hannifin Corporation vs Thomson Reuters Corporation
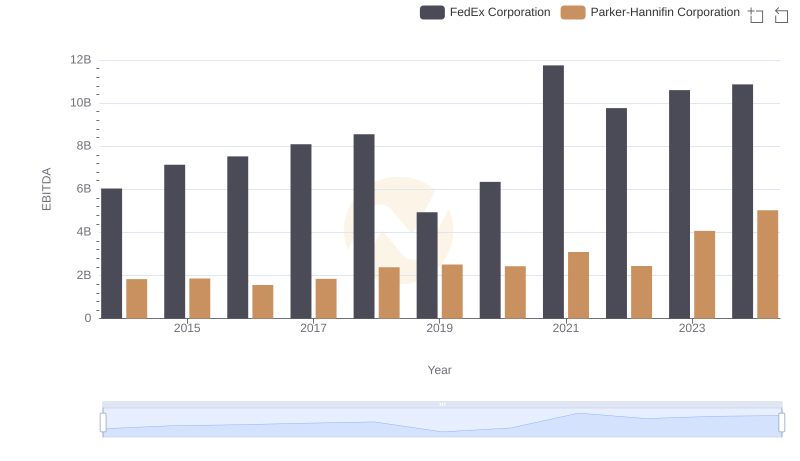
A Side-by-Side Analysis of EBITDA: Parker-Hannifin Corporation and FedEx Corporation
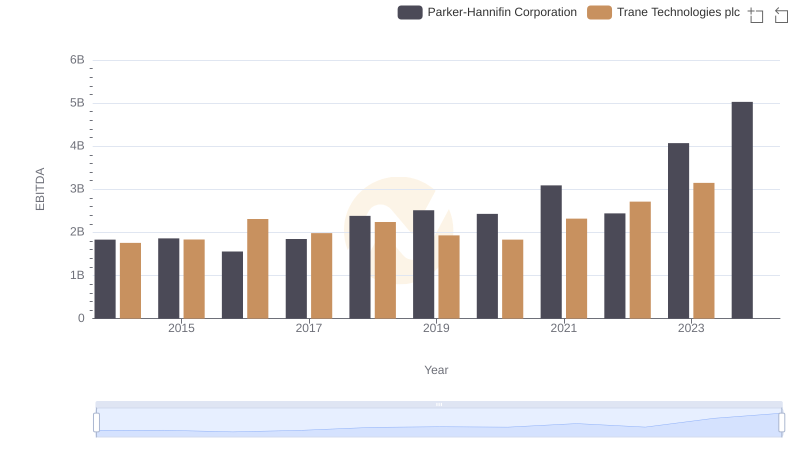
EBITDA Analysis: Evaluating Parker-Hannifin Corporation Against Trane Technologies plc

EBITDA Metrics Evaluated: Parker-Hannifin Corporation vs Illinois Tool Works Inc.
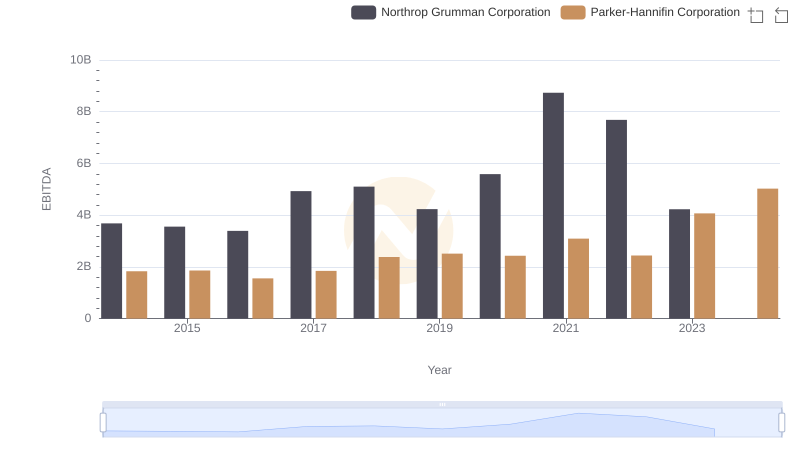
A Side-by-Side Analysis of EBITDA: Parker-Hannifin Corporation and Northrop Grumman Corporation
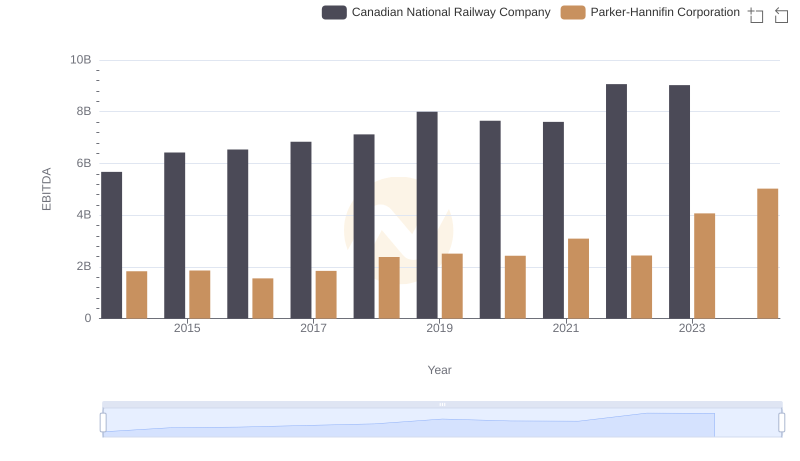
A Side-by-Side Analysis of EBITDA: Parker-Hannifin Corporation and Canadian National Railway Company