| __timestamp | Northrop Grumman Corporation | Parker-Hannifin Corporation |
|---|---|---|
| Wednesday, January 1, 2014 | 2405000000 | 1633992000 |
| Thursday, January 1, 2015 | 2566000000 | 1544746000 |
| Friday, January 1, 2016 | 2584000000 | 1359360000 |
| Sunday, January 1, 2017 | 2655000000 | 1453935000 |
| Monday, January 1, 2018 | 3011000000 | 1657152000 |
| Tuesday, January 1, 2019 | 3290000000 | 1543939000 |
| Wednesday, January 1, 2020 | 3413000000 | 1656553000 |
| Friday, January 1, 2021 | 3597000000 | 1527302000 |
| Saturday, January 1, 2022 | 3873000000 | 1627116000 |
| Sunday, January 1, 2023 | 4014000000 | 3354103000 |
| Monday, January 1, 2024 | 3992000000 | 3315177000 |
Data in motion
In the competitive landscape of industrial and defense sectors, understanding SG&A (Selling, General, and Administrative) efficiency is crucial. Over the past decade, Parker-Hannifin Corporation and Northrop Grumman Corporation have showcased distinct trends in their SG&A expenses. From 2014 to 2023, Northrop Grumman's SG&A expenses grew by approximately 67%, peaking in 2023. In contrast, Parker-Hannifin saw a significant spike in 2023, with expenses nearly doubling from the previous year. This divergence highlights strategic differences: Northrop Grumman's steady increase suggests a consistent investment in administrative capabilities, while Parker-Hannifin's recent surge may indicate a strategic pivot or expansion. Notably, data for 2024 is incomplete, leaving room for speculation on future trends. As these industry leaders navigate economic challenges, their SG&A strategies will be pivotal in maintaining competitive edges.
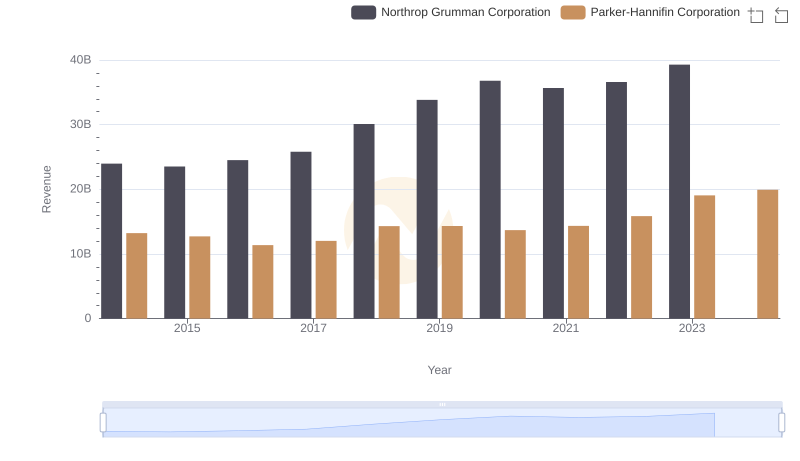
Revenue Insights: Parker-Hannifin Corporation and Northrop Grumman Corporation Performance Compared
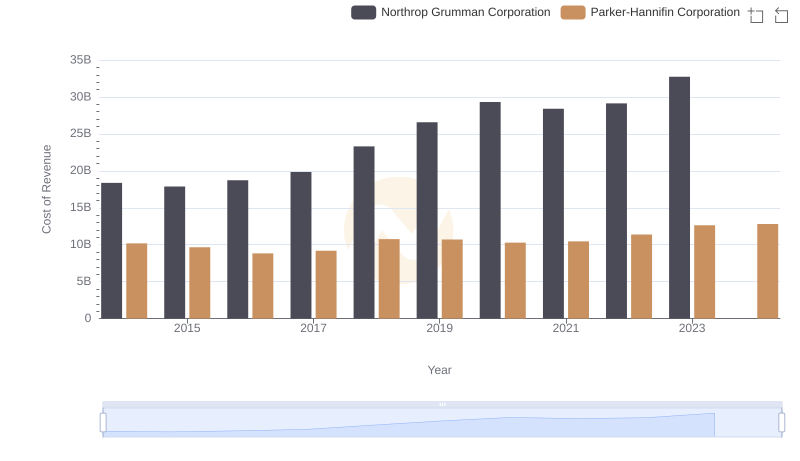
Cost Insights: Breaking Down Parker-Hannifin Corporation and Northrop Grumman Corporation's Expenses
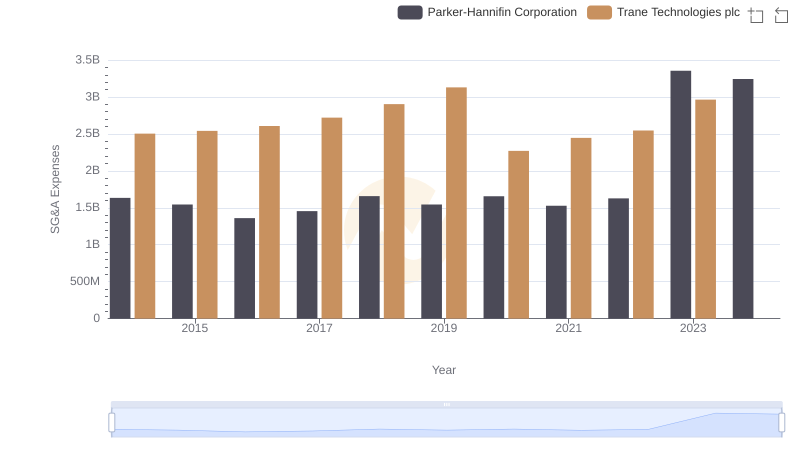
Parker-Hannifin Corporation vs Trane Technologies plc: SG&A Expense Trends
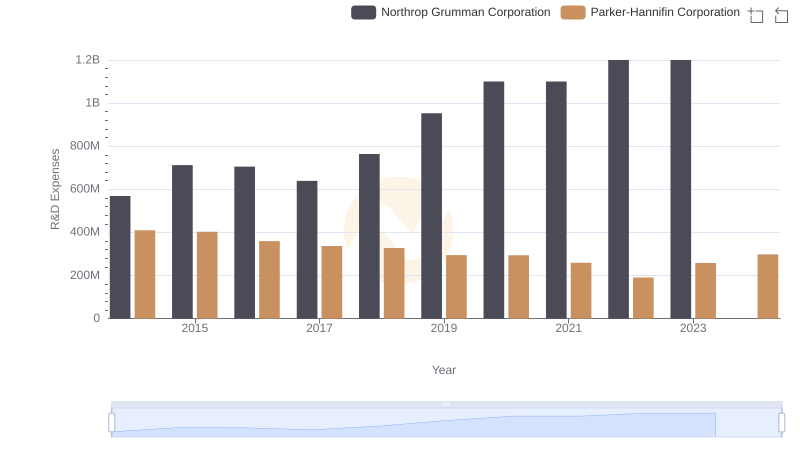
R&D Insights: How Parker-Hannifin Corporation and Northrop Grumman Corporation Allocate Funds
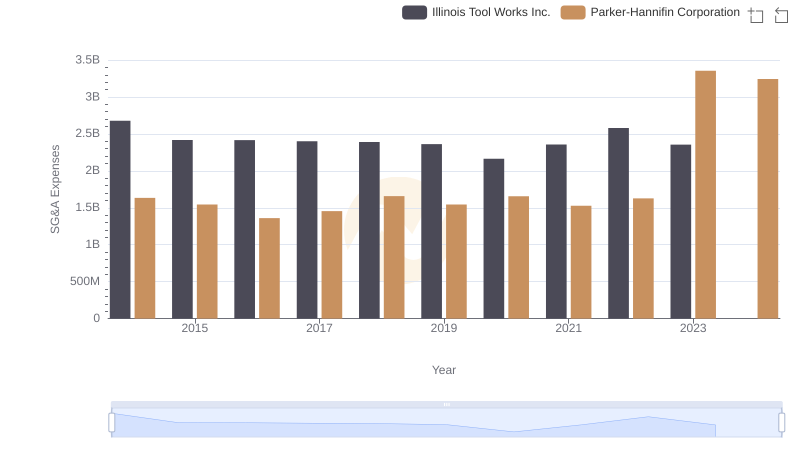
Breaking Down SG&A Expenses: Parker-Hannifin Corporation vs Illinois Tool Works Inc.
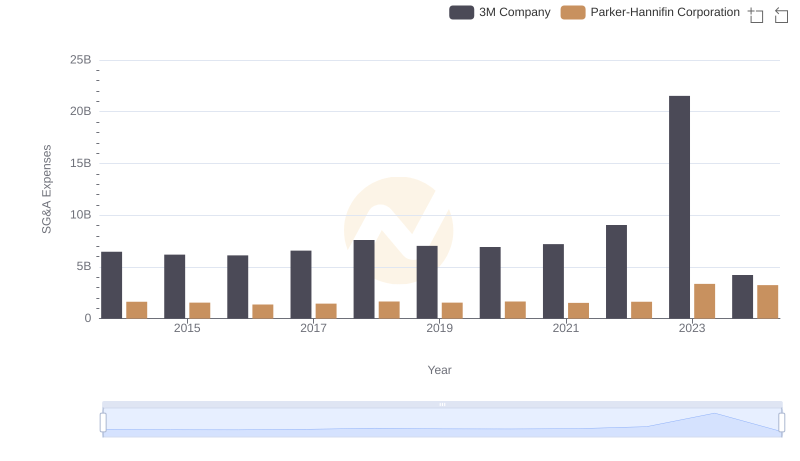
Parker-Hannifin Corporation and 3M Company: SG&A Spending Patterns Compared
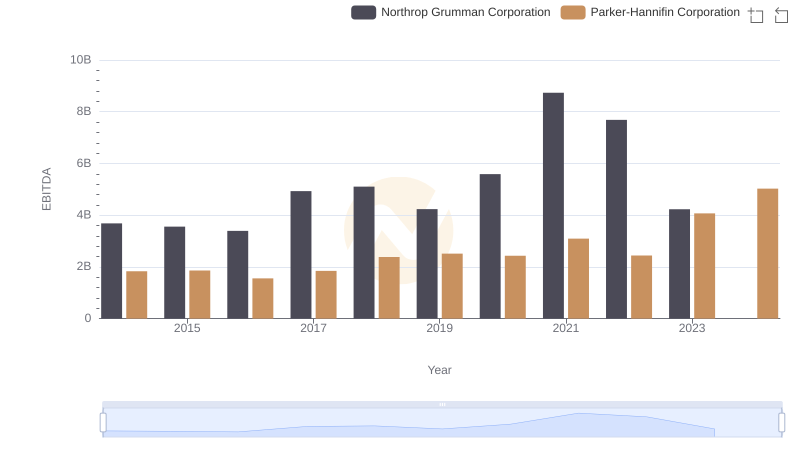
A Side-by-Side Analysis of EBITDA: Parker-Hannifin Corporation and Northrop Grumman Corporation
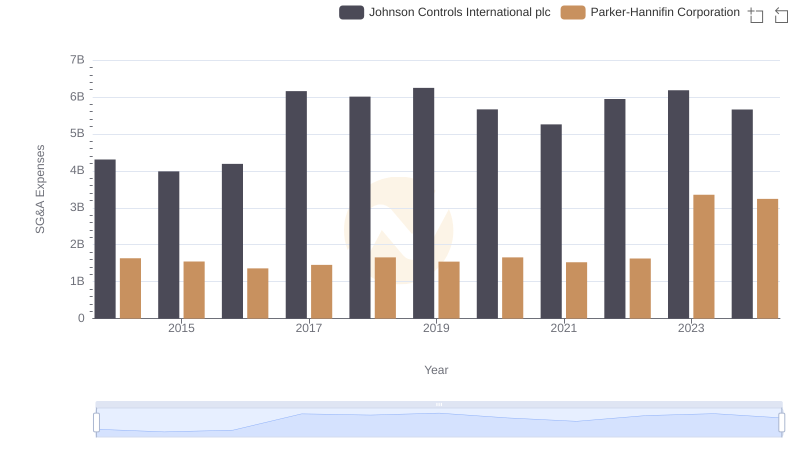
Parker-Hannifin Corporation or Johnson Controls International plc: Who Manages SG&A Costs Better?