| __timestamp | Parker-Hannifin Corporation | Trane Technologies plc |
|---|---|---|
| Wednesday, January 1, 2014 | 1832903000 | 1757000000 |
| Thursday, January 1, 2015 | 1861551000 | 1835000000 |
| Friday, January 1, 2016 | 1558088000 | 2311000000 |
| Sunday, January 1, 2017 | 1846306000 | 1982500000 |
| Monday, January 1, 2018 | 2382235000 | 2242400000 |
| Tuesday, January 1, 2019 | 2513468000 | 1931200000 |
| Wednesday, January 1, 2020 | 2431500000 | 1831900000 |
| Friday, January 1, 2021 | 3092383000 | 2319200000 |
| Saturday, January 1, 2022 | 2441242000 | 2715500000 |
| Sunday, January 1, 2023 | 4071687000 | 3149900000 |
| Monday, January 1, 2024 | 5028229000 | 3859600000 |
Unlocking the unknown
In the ever-evolving landscape of industrial giants, Parker-Hannifin Corporation and Trane Technologies plc have emerged as key players. Over the past decade, Parker-Hannifin has demonstrated a remarkable growth trajectory, with its EBITDA increasing by approximately 175% from 2014 to 2023. This growth is particularly notable in 2023, where Parker-Hannifin's EBITDA surged to over 5 billion, marking a significant leap from previous years.
Conversely, Trane Technologies has shown a steady yet modest growth, with its EBITDA peaking in 2023 at around 3.15 billion. Despite this, Trane's performance in 2016 was a standout, surpassing Parker-Hannifin's EBITDA by nearly 50%.
The data highlights Parker-Hannifin's aggressive expansion strategy, while Trane Technologies maintains a consistent, albeit slower, growth path. Missing data for 2024 suggests potential volatility or strategic shifts in Trane's financial reporting.
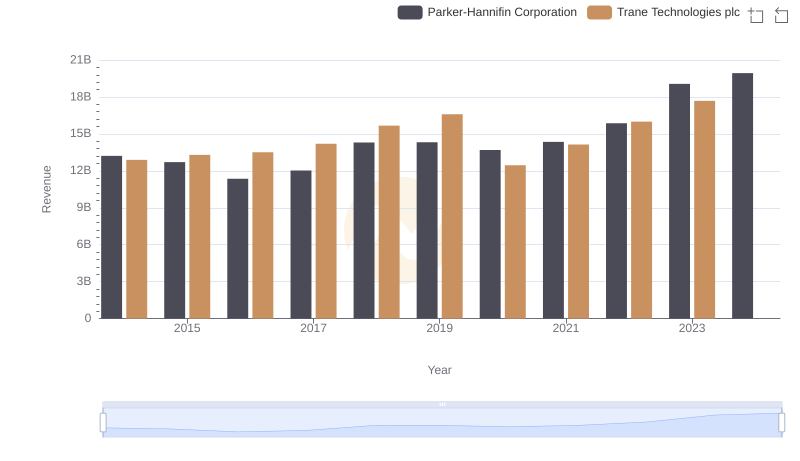
Breaking Down Revenue Trends: Parker-Hannifin Corporation vs Trane Technologies plc
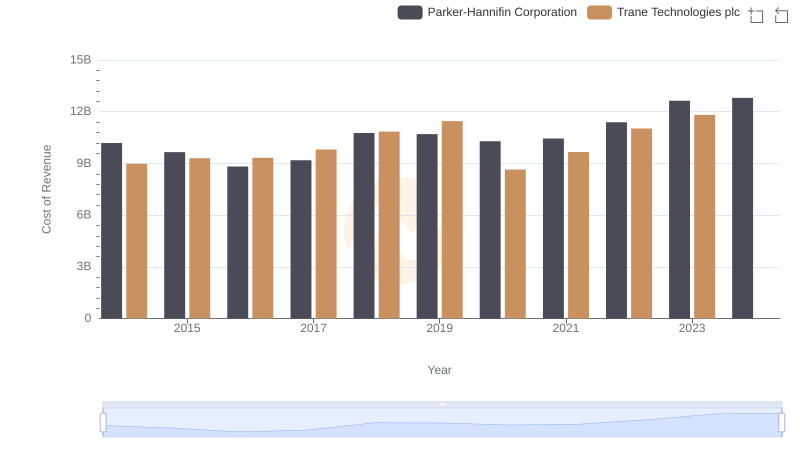
Cost Insights: Breaking Down Parker-Hannifin Corporation and Trane Technologies plc's Expenses
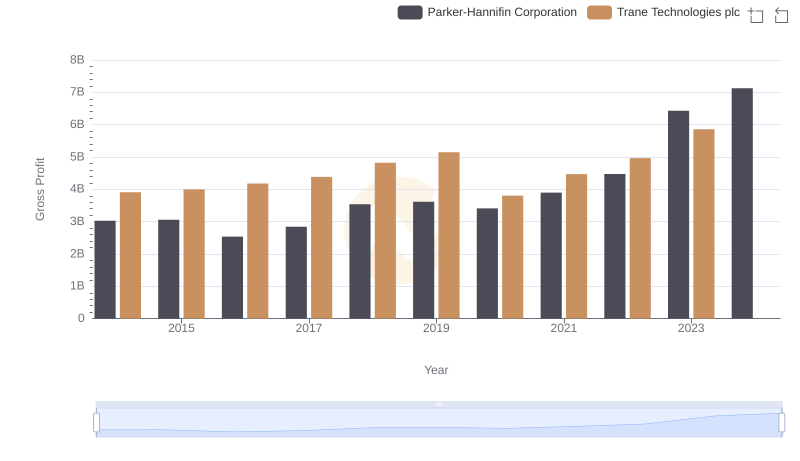
Gross Profit Analysis: Comparing Parker-Hannifin Corporation and Trane Technologies plc
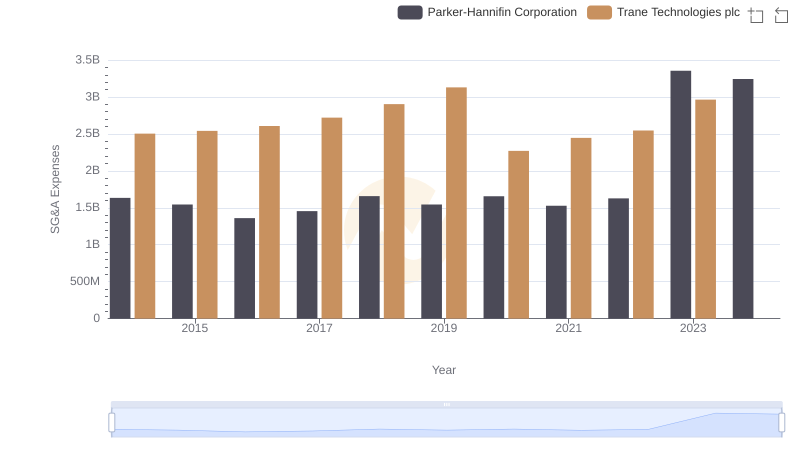
Parker-Hannifin Corporation vs Trane Technologies plc: SG&A Expense Trends
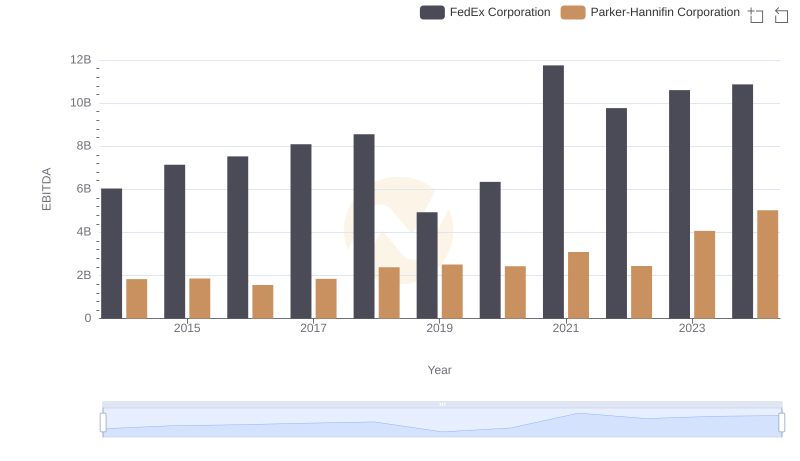
A Side-by-Side Analysis of EBITDA: Parker-Hannifin Corporation and FedEx Corporation

EBITDA Metrics Evaluated: Parker-Hannifin Corporation vs Illinois Tool Works Inc.
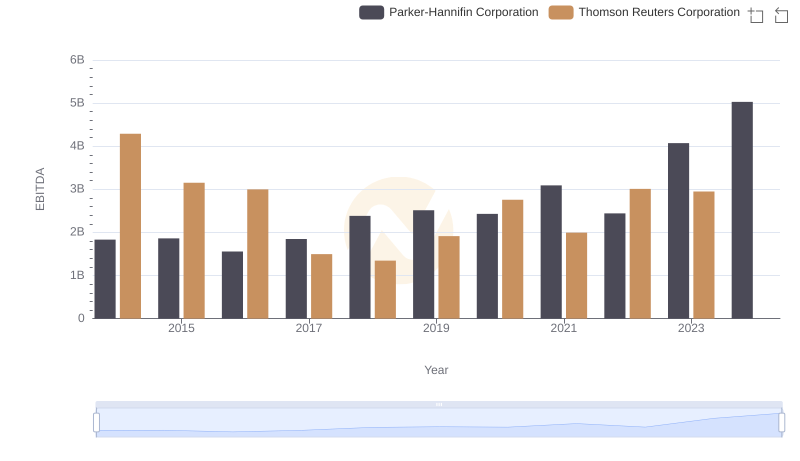
Parker-Hannifin Corporation vs Thomson Reuters Corporation: In-Depth EBITDA Performance Comparison
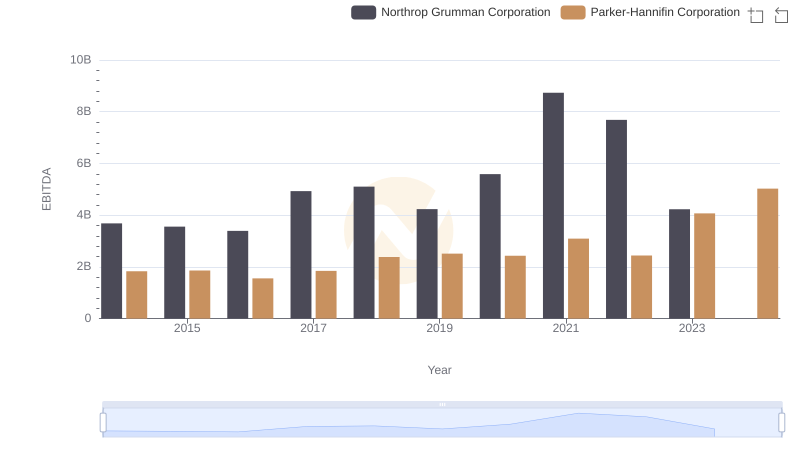
A Side-by-Side Analysis of EBITDA: Parker-Hannifin Corporation and Northrop Grumman Corporation