| __timestamp | CSX Corporation | TFI International Inc. |
|---|---|---|
| Wednesday, January 1, 2014 | 4740000000 | 334908602 |
| Thursday, January 1, 2015 | 4890000000 | 314924803 |
| Friday, January 1, 2016 | 4640000000 | 325584405 |
| Sunday, January 1, 2017 | 5113000000 | 517899005 |
| Monday, January 1, 2018 | 6274000000 | 521265317 |
| Tuesday, January 1, 2019 | 6402000000 | 674440000 |
| Wednesday, January 1, 2020 | 5764000000 | 709296000 |
| Friday, January 1, 2021 | 6653000000 | 1358717000 |
| Saturday, January 1, 2022 | 7390000000 | 1561728000 |
| Sunday, January 1, 2023 | 7340000000 | 1194213000 |
Unlocking the unknown
In the ever-evolving landscape of the transportation industry, understanding the financial health of key players is crucial. This analysis delves into the EBITDA performance of two giants: CSX Corporation and TFI International Inc., from 2014 to 2023.
CSX Corporation, a leader in rail transportation, has shown a robust growth trajectory, with its EBITDA increasing by approximately 55% over the decade. Notably, 2022 marked a peak with a 7% rise from the previous year, reaching its highest at $7.39 billion.
On the other hand, TFI International Inc., a major player in logistics and transportation, demonstrated a remarkable 370% growth in EBITDA, peaking in 2022. Despite a slight dip in 2023, TFI's strategic expansions have solidified its position in the market.
This side-by-side analysis highlights the dynamic shifts and strategic maneuvers within the industry, offering valuable insights for investors and stakeholders.
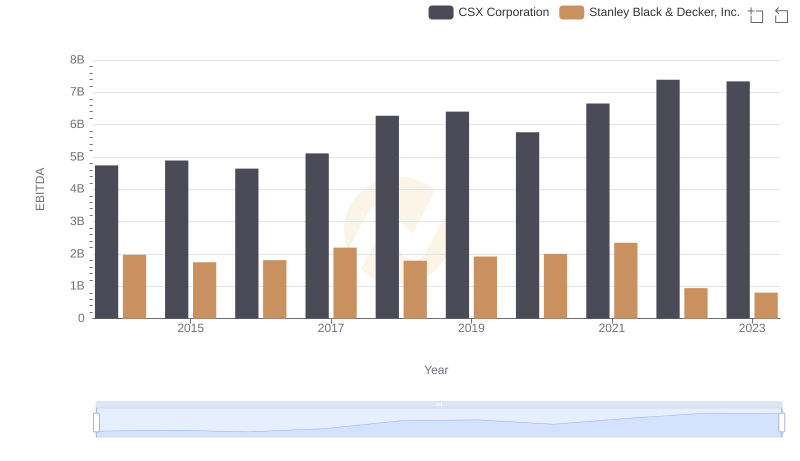
A Professional Review of EBITDA: CSX Corporation Compared to Stanley Black & Decker, Inc.
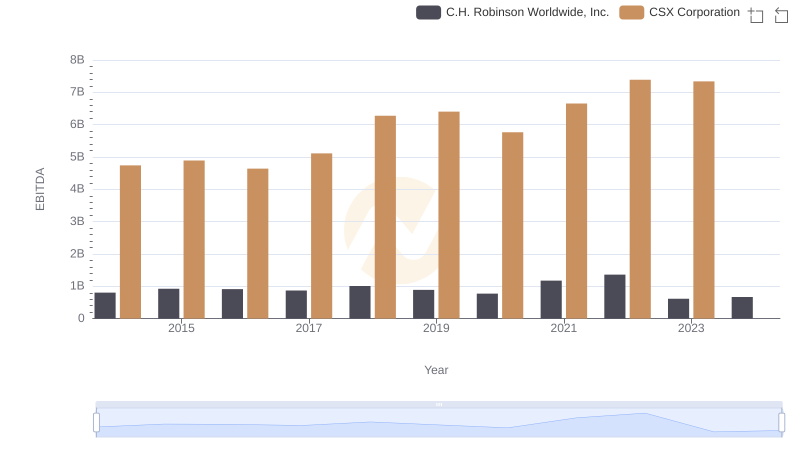
A Professional Review of EBITDA: CSX Corporation Compared to C.H. Robinson Worldwide, Inc.
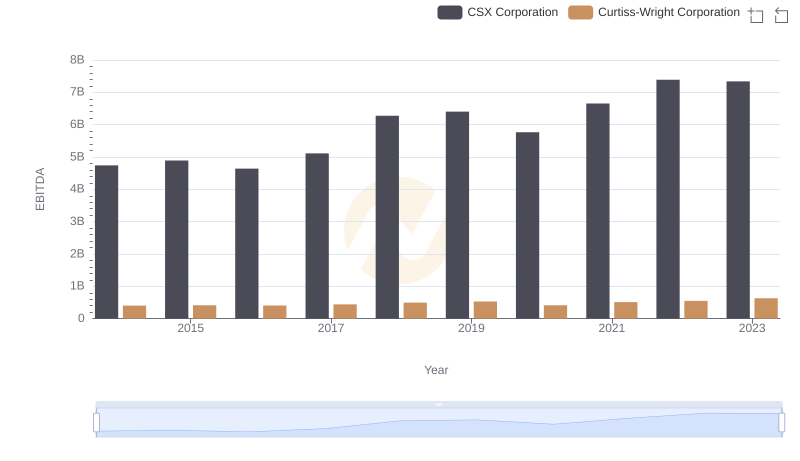
CSX Corporation and Curtiss-Wright Corporation: A Detailed Examination of EBITDA Performance
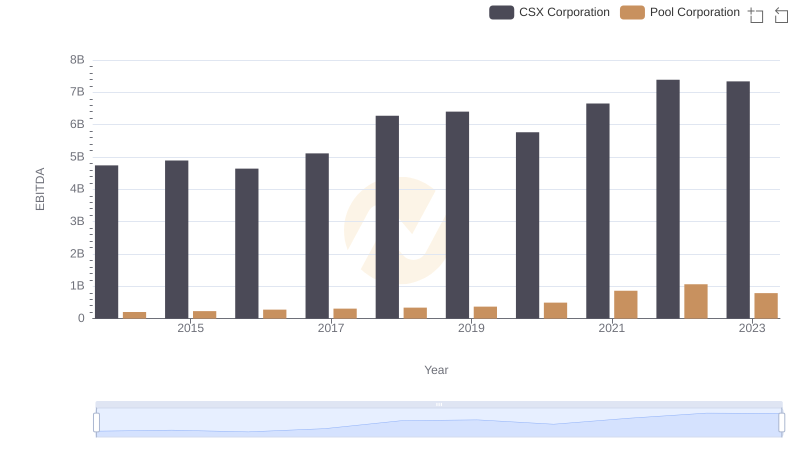
EBITDA Performance Review: CSX Corporation vs Pool Corporation
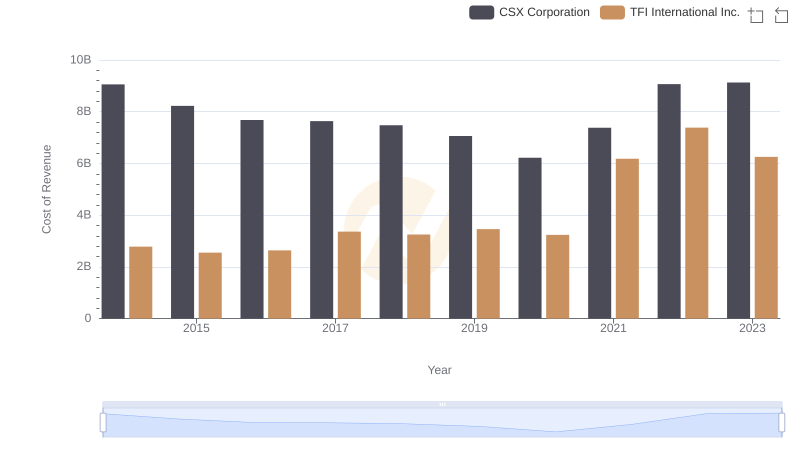
Cost of Revenue: Key Insights for CSX Corporation and TFI International Inc.
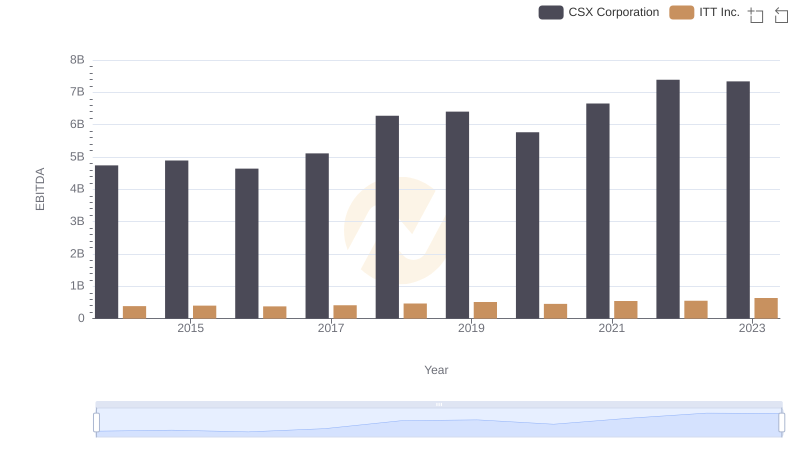
CSX Corporation and ITT Inc.: A Detailed Examination of EBITDA Performance
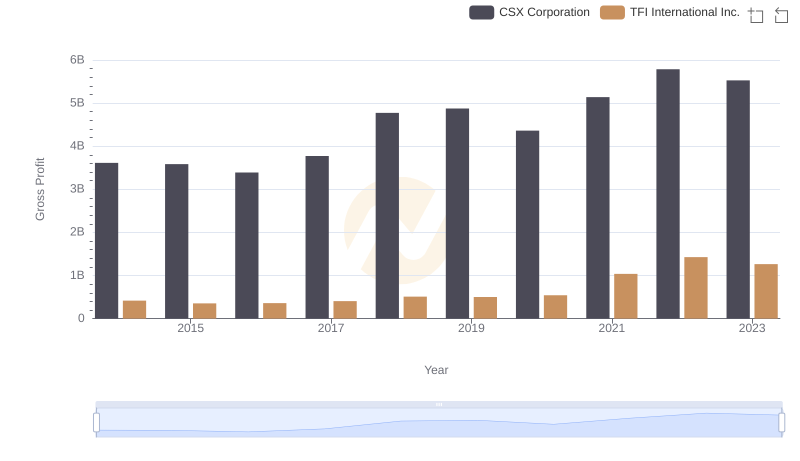
Key Insights on Gross Profit: CSX Corporation vs TFI International Inc.
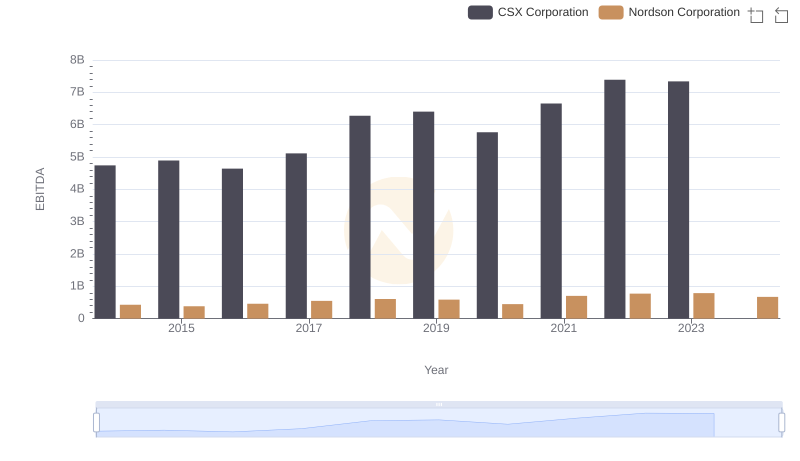
A Professional Review of EBITDA: CSX Corporation Compared to Nordson Corporation
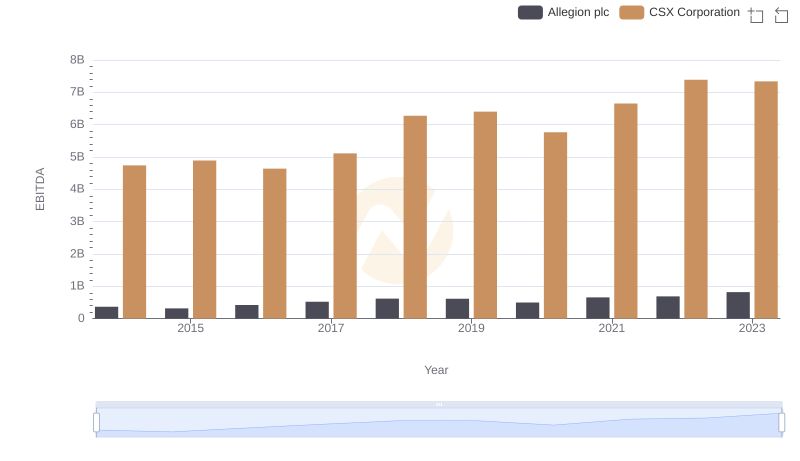
Professional EBITDA Benchmarking: CSX Corporation vs Allegion plc
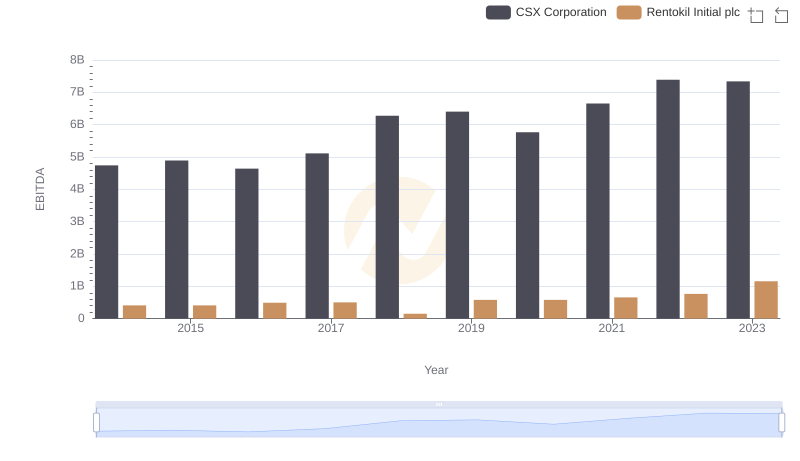
Professional EBITDA Benchmarking: CSX Corporation vs Rentokil Initial plc