| __timestamp | CSX Corporation | Pool Corporation |
|---|---|---|
| Wednesday, January 1, 2014 | 4740000000 | 204752000 |
| Thursday, January 1, 2015 | 4890000000 | 233610000 |
| Friday, January 1, 2016 | 4640000000 | 277836000 |
| Sunday, January 1, 2017 | 5113000000 | 310096000 |
| Monday, January 1, 2018 | 6274000000 | 341804000 |
| Tuesday, January 1, 2019 | 6402000000 | 370520000 |
| Wednesday, January 1, 2020 | 5764000000 | 493425000 |
| Friday, January 1, 2021 | 6653000000 | 862810000 |
| Saturday, January 1, 2022 | 7390000000 | 1064808000 |
| Sunday, January 1, 2023 | 7340000000 | 786707000 |
Unleashing the power of data
In the ever-evolving landscape of American business, the performance of CSX Corporation and Pool Corporation over the past decade offers a fascinating study in financial growth. From 2014 to 2023, CSX Corporation has consistently outperformed Pool Corporation in terms of EBITDA, showcasing a robust growth trajectory. Starting at approximately $4.7 billion in 2014, CSX's EBITDA surged by nearly 56% to reach $7.34 billion in 2023. This growth underscores CSX's strategic prowess in the transportation sector.
Conversely, Pool Corporation, a leader in the pool supply industry, demonstrated a remarkable 384% increase in EBITDA, climbing from $205 million in 2014 to $787 million in 2023. This impressive growth reflects Pool's ability to capitalize on the rising demand for leisure and home improvement products. As we delve into these figures, it becomes evident that both companies have navigated their respective markets with agility and foresight.
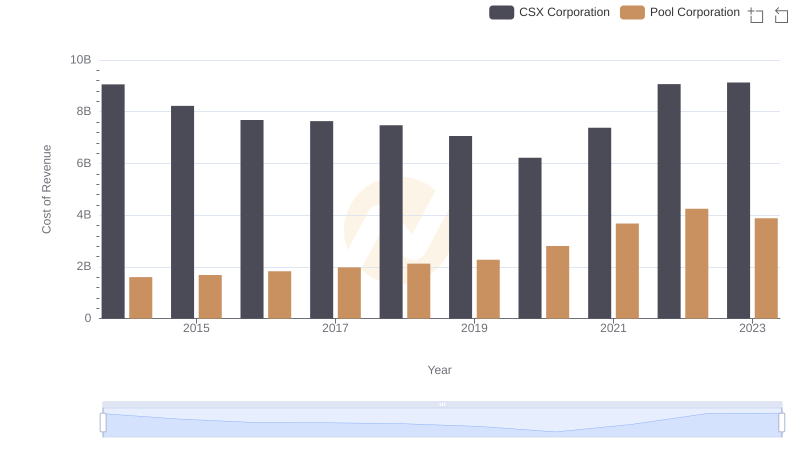
Comparing Cost of Revenue Efficiency: CSX Corporation vs Pool Corporation
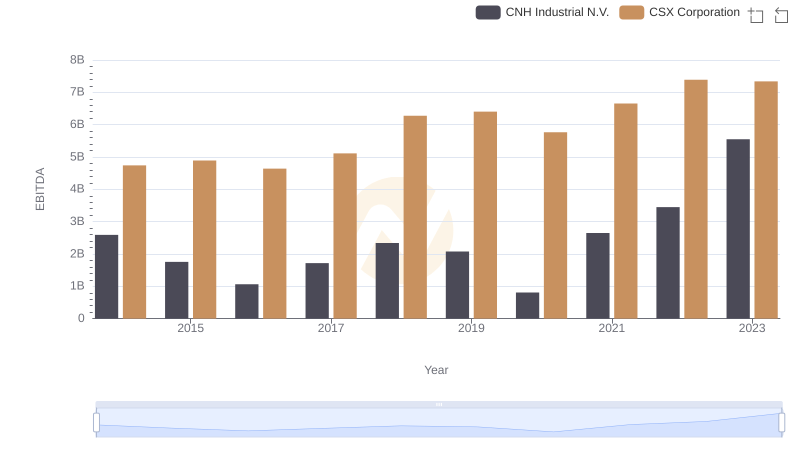
CSX Corporation and CNH Industrial N.V.: A Detailed Examination of EBITDA Performance
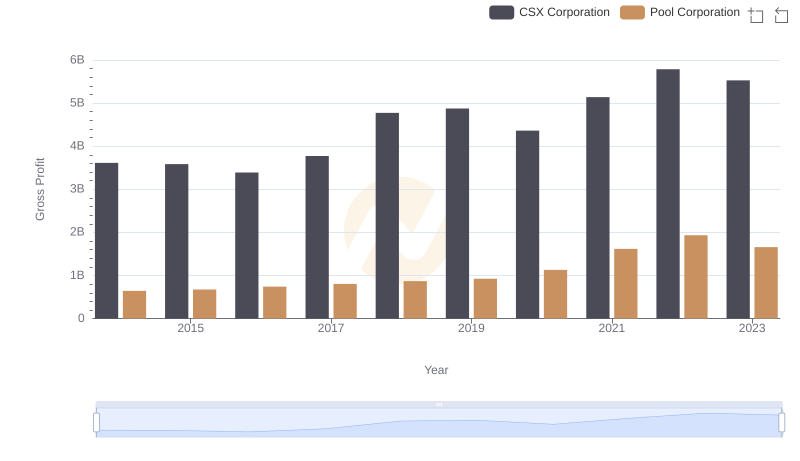
CSX Corporation vs Pool Corporation: A Gross Profit Performance Breakdown
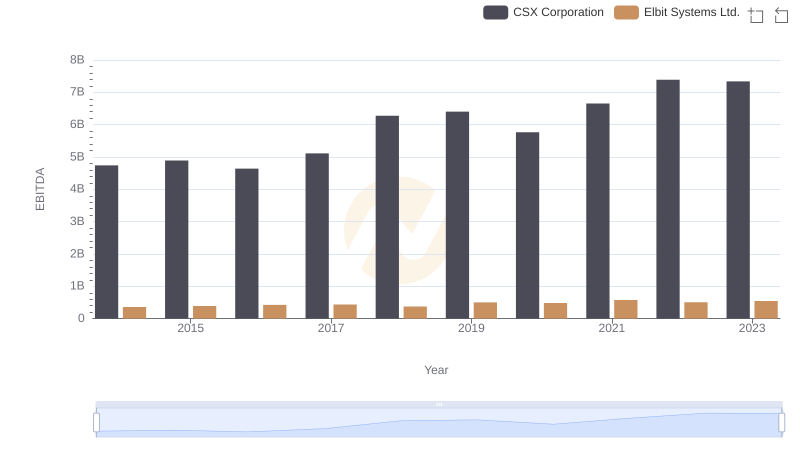
CSX Corporation vs Elbit Systems Ltd.: In-Depth EBITDA Performance Comparison
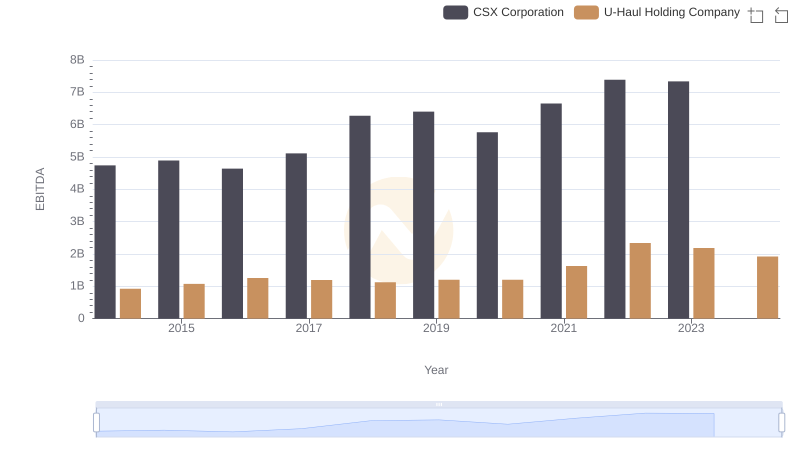
CSX Corporation vs U-Haul Holding Company: In-Depth EBITDA Performance Comparison
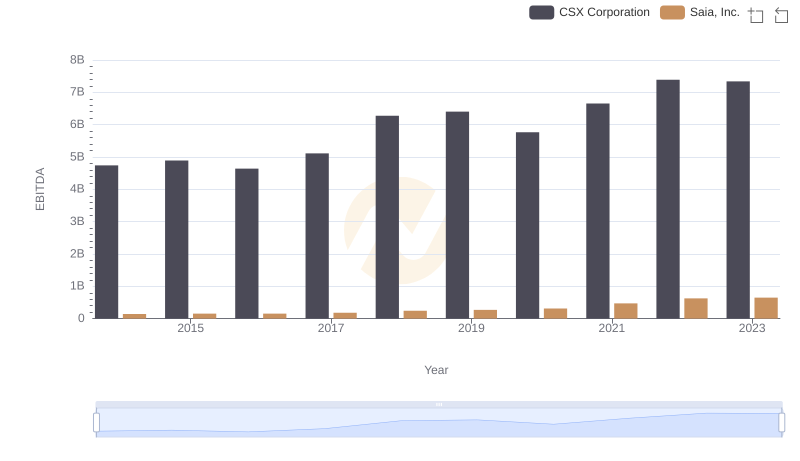
EBITDA Performance Review: CSX Corporation vs Saia, Inc.
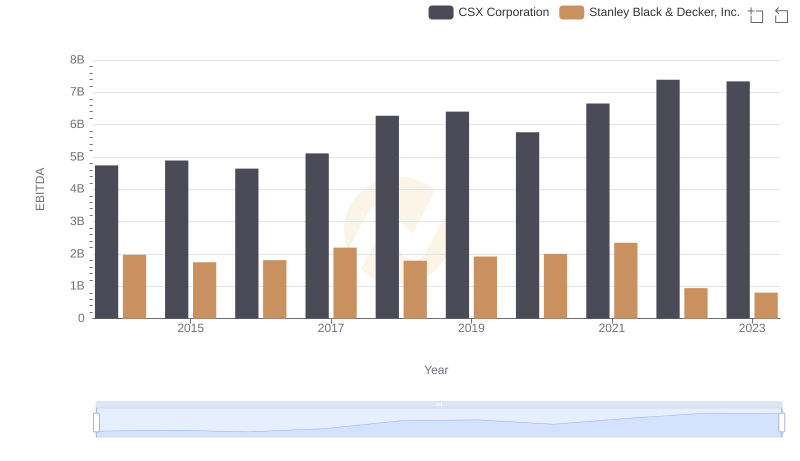
A Professional Review of EBITDA: CSX Corporation Compared to Stanley Black & Decker, Inc.
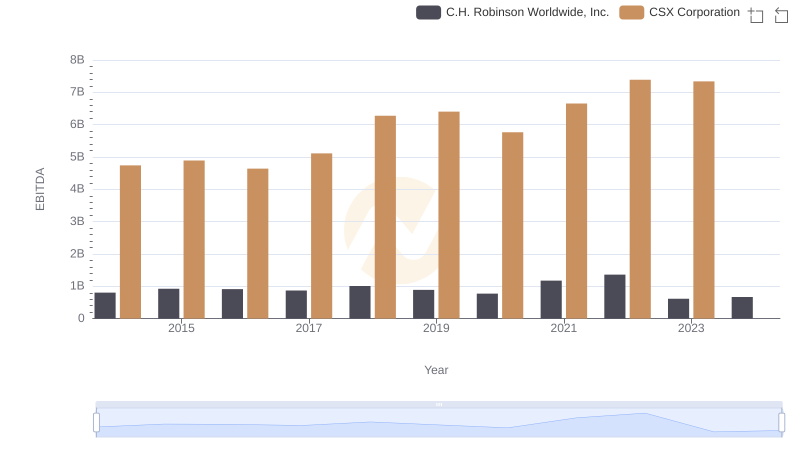
A Professional Review of EBITDA: CSX Corporation Compared to C.H. Robinson Worldwide, Inc.
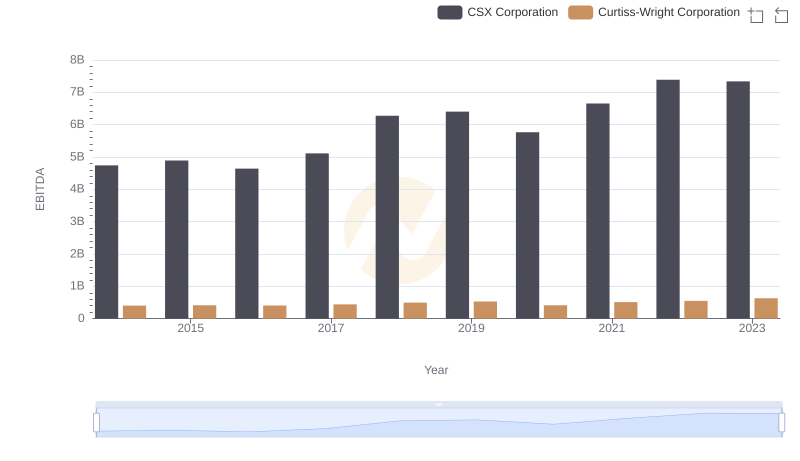
CSX Corporation and Curtiss-Wright Corporation: A Detailed Examination of EBITDA Performance
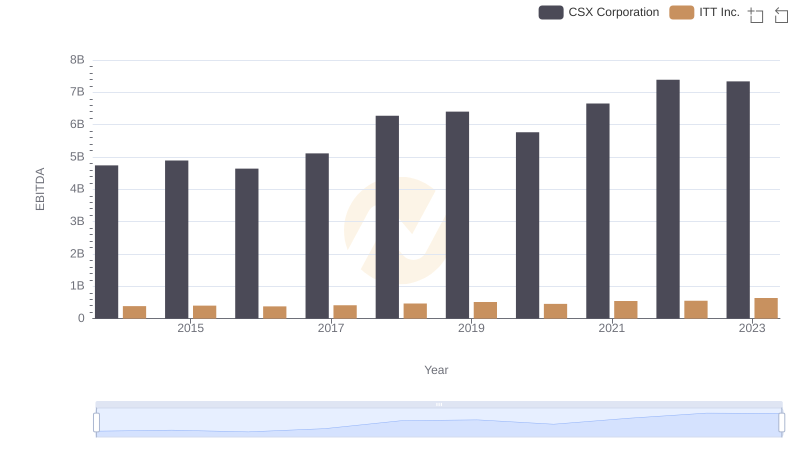
CSX Corporation and ITT Inc.: A Detailed Examination of EBITDA Performance