| __timestamp | CSX Corporation | TFI International Inc. |
|---|---|---|
| Wednesday, January 1, 2014 | 9056000000 | 2782605137 |
| Thursday, January 1, 2015 | 8227000000 | 2551474032 |
| Friday, January 1, 2016 | 7680000000 | 2636493564 |
| Sunday, January 1, 2017 | 7635000000 | 3364979721 |
| Monday, January 1, 2018 | 7477000000 | 3251443800 |
| Tuesday, January 1, 2019 | 7063000000 | 3461987950 |
| Wednesday, January 1, 2020 | 6221000000 | 3239249000 |
| Friday, January 1, 2021 | 7382000000 | 6182566000 |
| Saturday, January 1, 2022 | 9068000000 | 7385640000 |
| Sunday, January 1, 2023 | 9130000000 | 6255775000 |
Unleashing the power of data
In the ever-evolving landscape of the transportation industry, understanding cost dynamics is crucial. Over the past decade, CSX Corporation and TFI International Inc. have showcased intriguing trends in their cost of revenue. From 2014 to 2023, CSX Corporation's cost of revenue fluctuated, peaking in 2023 with a 47% increase from its lowest point in 2020. Meanwhile, TFI International Inc. experienced a remarkable 180% surge from 2014 to 2022, reflecting its aggressive expansion and operational efficiency.
These insights provide a window into the strategic maneuvers of two industry giants, offering valuable lessons for stakeholders and investors alike.
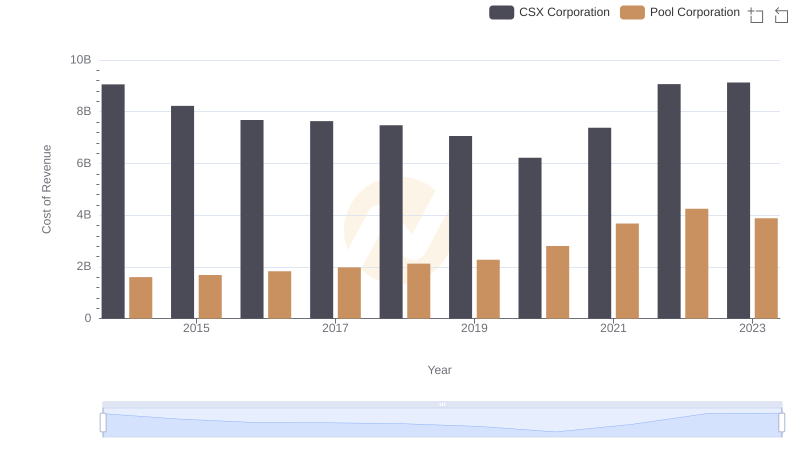
Comparing Cost of Revenue Efficiency: CSX Corporation vs Pool Corporation
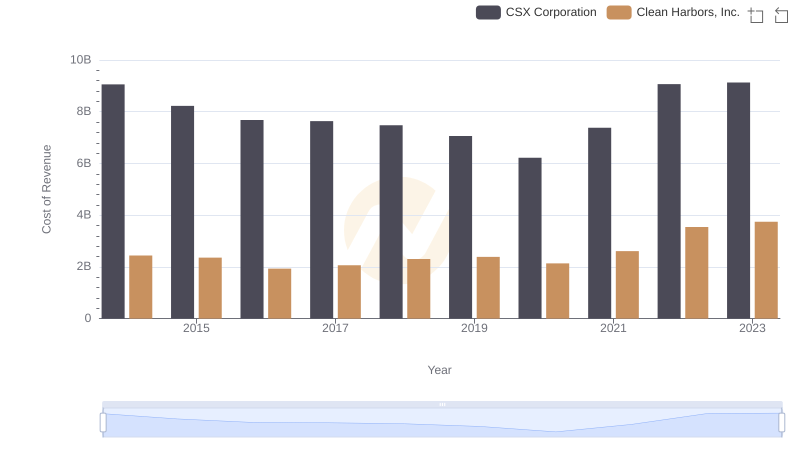
Cost of Revenue Comparison: CSX Corporation vs Clean Harbors, Inc.
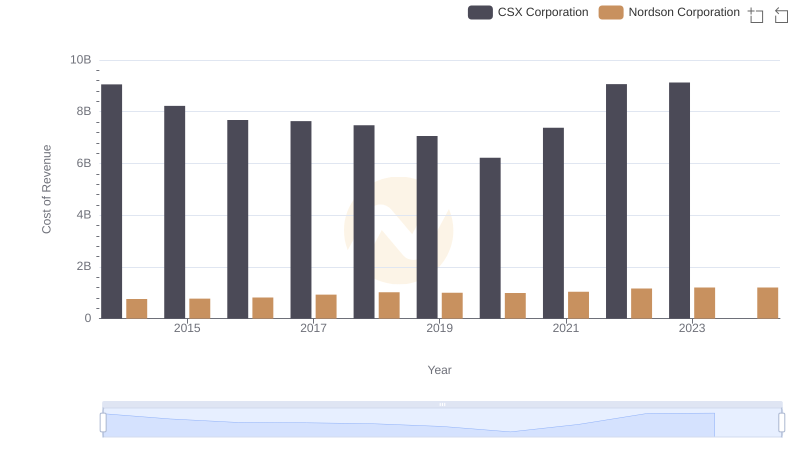
Cost Insights: Breaking Down CSX Corporation and Nordson Corporation's Expenses
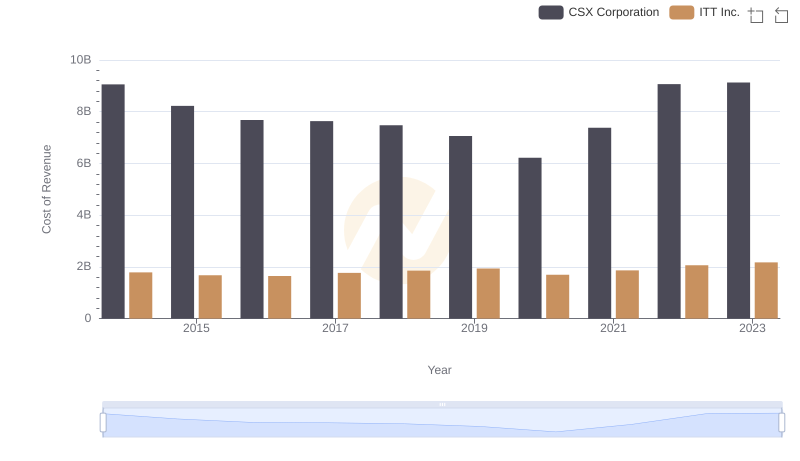
Cost of Revenue: Key Insights for CSX Corporation and ITT Inc.
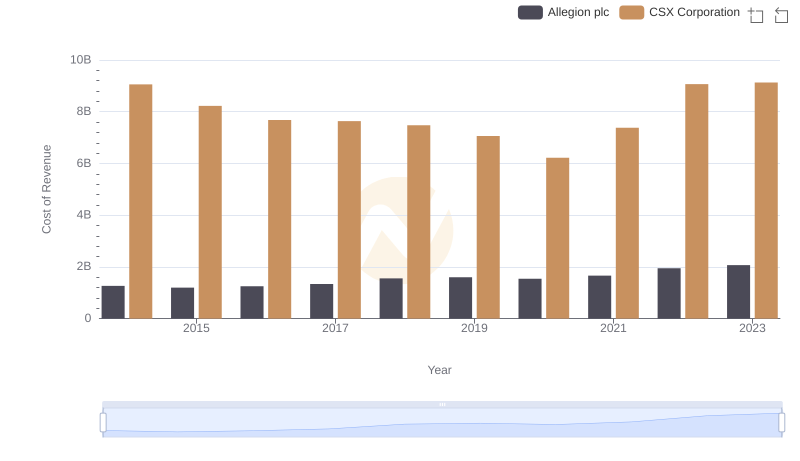
CSX Corporation vs Allegion plc: Efficiency in Cost of Revenue Explored
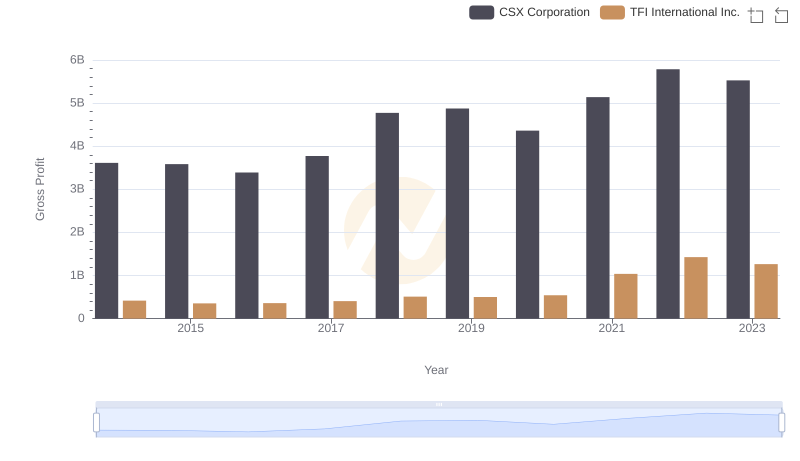
Key Insights on Gross Profit: CSX Corporation vs TFI International Inc.

A Side-by-Side Analysis of EBITDA: CSX Corporation and TFI International Inc.