| __timestamp | CSX Corporation | TFI International Inc. |
|---|---|---|
| Wednesday, January 1, 2014 | 3613000000 | 417323364 |
| Thursday, January 1, 2015 | 3584000000 | 352552803 |
| Friday, January 1, 2016 | 3389000000 | 358230042 |
| Sunday, January 1, 2017 | 3773000000 | 405214314 |
| Monday, January 1, 2018 | 4773000000 | 510006388 |
| Tuesday, January 1, 2019 | 4874000000 | 502631921 |
| Wednesday, January 1, 2020 | 4362000000 | 541885000 |
| Friday, January 1, 2021 | 5140000000 | 1037863000 |
| Saturday, January 1, 2022 | 5785000000 | 1426851000 |
| Sunday, January 1, 2023 | 5527000000 | 1265392000 |
Unlocking the unknown
In the ever-evolving landscape of the transportation industry, understanding financial performance is crucial. Over the past decade, CSX Corporation and TFI International Inc. have showcased distinct trajectories in their gross profit margins. From 2014 to 2023, CSX Corporation consistently outperformed TFI International, with gross profits peaking at approximately $5.8 billion in 2022, marking a 70% increase from 2014. In contrast, TFI International's gross profit grew by over 200%, reaching around $1.4 billion in 2022. This growth trajectory highlights TFI's aggressive expansion and strategic acquisitions. However, CSX's steady growth underscores its robust operational efficiency and market dominance. As we look to the future, these trends offer valuable insights into the competitive dynamics and financial health of these industry giants.
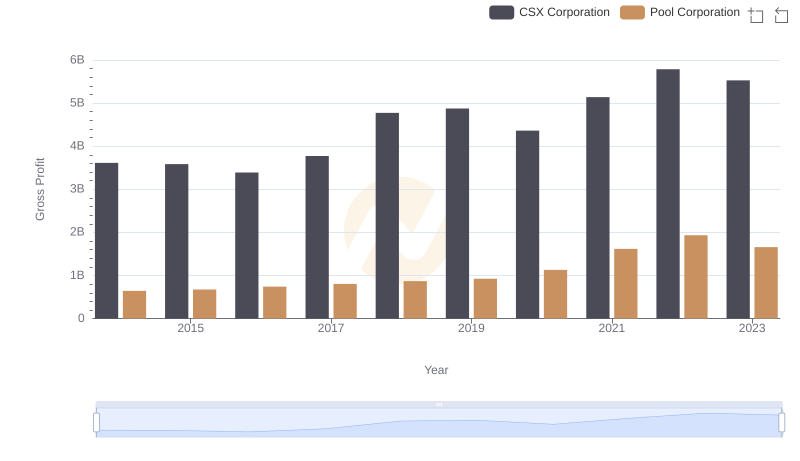
CSX Corporation vs Pool Corporation: A Gross Profit Performance Breakdown
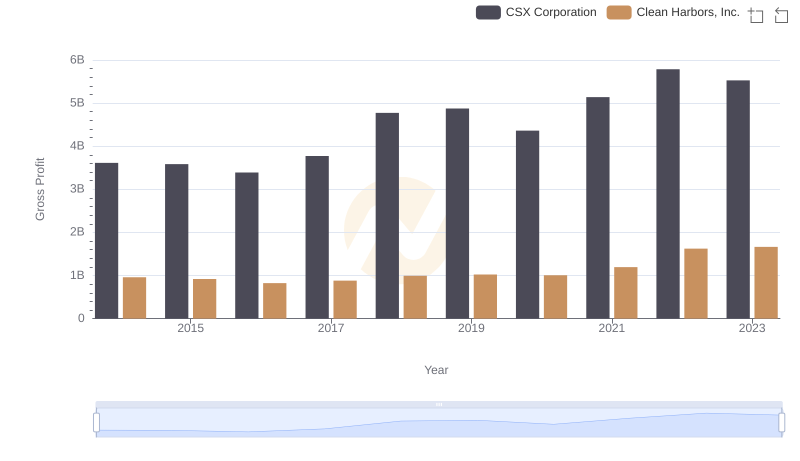
Gross Profit Analysis: Comparing CSX Corporation and Clean Harbors, Inc.
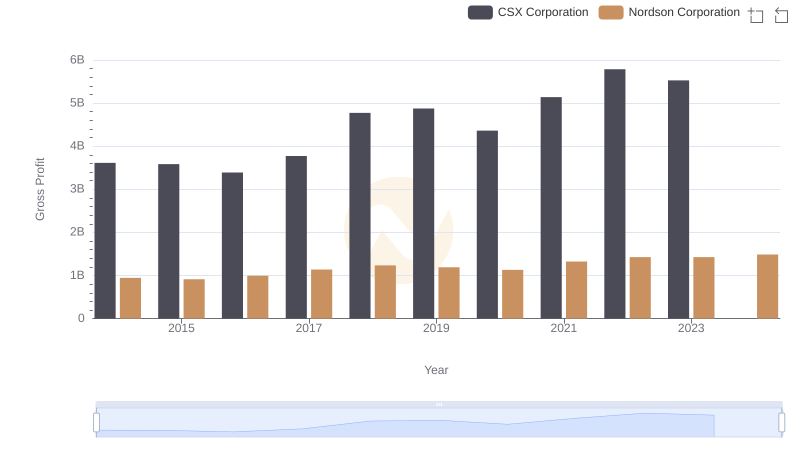
Gross Profit Trends Compared: CSX Corporation vs Nordson Corporation
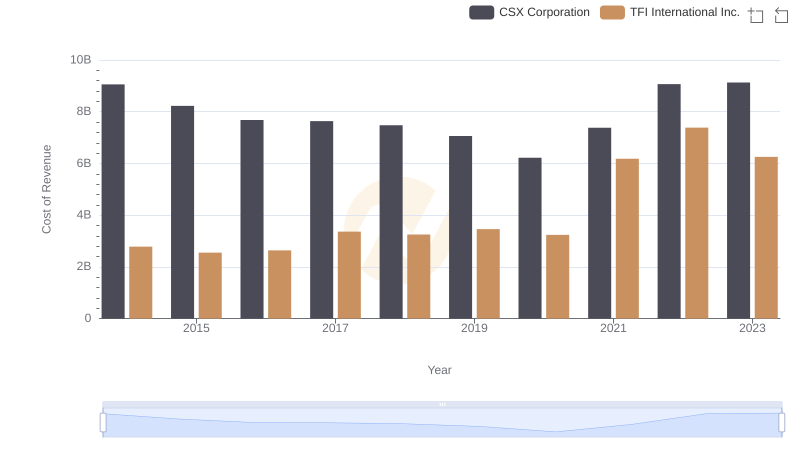
Cost of Revenue: Key Insights for CSX Corporation and TFI International Inc.
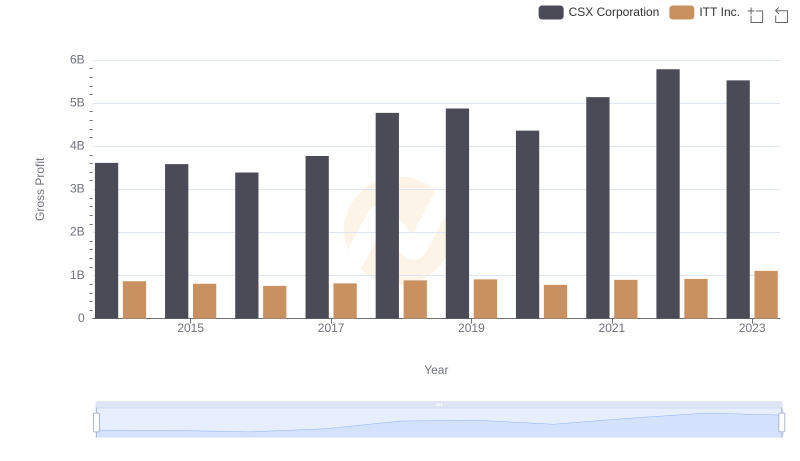
Gross Profit Comparison: CSX Corporation and ITT Inc. Trends
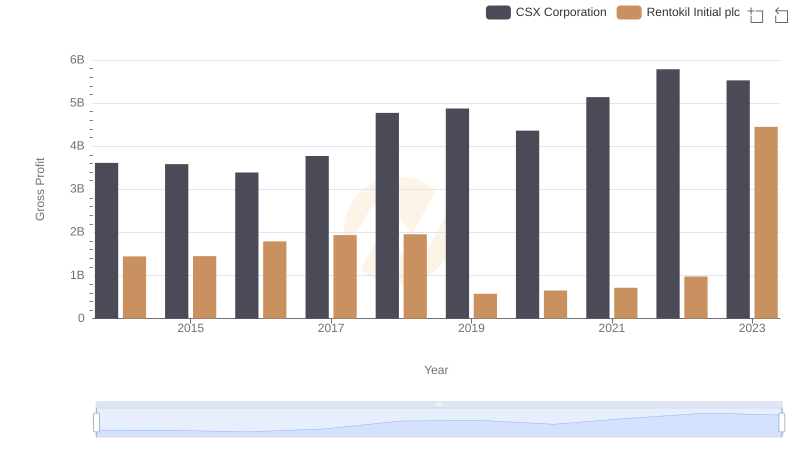
Gross Profit Comparison: CSX Corporation and Rentokil Initial plc Trends
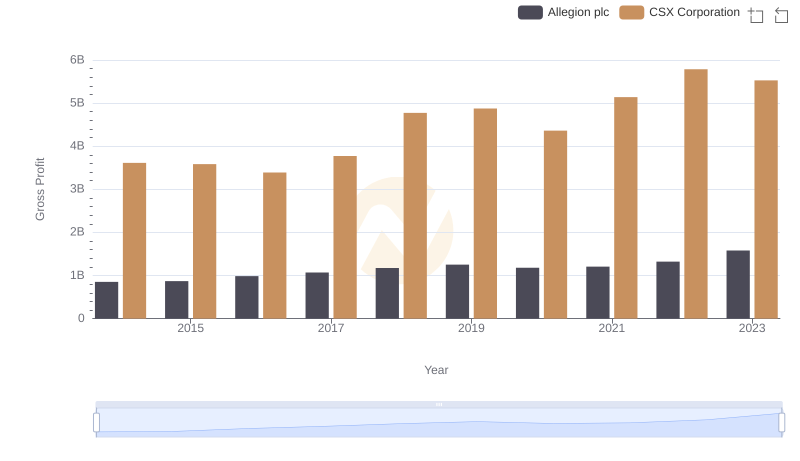
Gross Profit Trends Compared: CSX Corporation vs Allegion plc

A Side-by-Side Analysis of EBITDA: CSX Corporation and TFI International Inc.