| __timestamp | Allegion plc | CSX Corporation |
|---|---|---|
| Wednesday, January 1, 2014 | 365700000 | 4740000000 |
| Thursday, January 1, 2015 | 315400000 | 4890000000 |
| Friday, January 1, 2016 | 422600000 | 4640000000 |
| Sunday, January 1, 2017 | 523300000 | 5113000000 |
| Monday, January 1, 2018 | 617600000 | 6274000000 |
| Tuesday, January 1, 2019 | 614300000 | 6402000000 |
| Wednesday, January 1, 2020 | 497700000 | 5764000000 |
| Friday, January 1, 2021 | 657300000 | 6653000000 |
| Saturday, January 1, 2022 | 688300000 | 7390000000 |
| Sunday, January 1, 2023 | 819300000 | 7340000000 |
| Monday, January 1, 2024 | 919800000 |
Infusing magic into the data realm
In the world of corporate finance, EBITDA serves as a crucial indicator of a company's operational performance. This article delves into the EBITDA trends of two industry titans: CSX Corporation and Allegion plc, from 2014 to 2023.
CSX Corporation, a leader in the transportation sector, showcased a robust growth trajectory with a 55% increase in EBITDA over the decade, peaking in 2022. Meanwhile, Allegion plc, a key player in security products, demonstrated a remarkable 160% growth, reflecting its strategic market expansions and operational efficiencies.
Despite economic fluctuations, both companies maintained resilience, with CSX consistently outperforming Allegion in absolute EBITDA terms. However, Allegion's rapid growth rate highlights its potential to close the gap. This analysis underscores the importance of strategic adaptability in sustaining financial health.
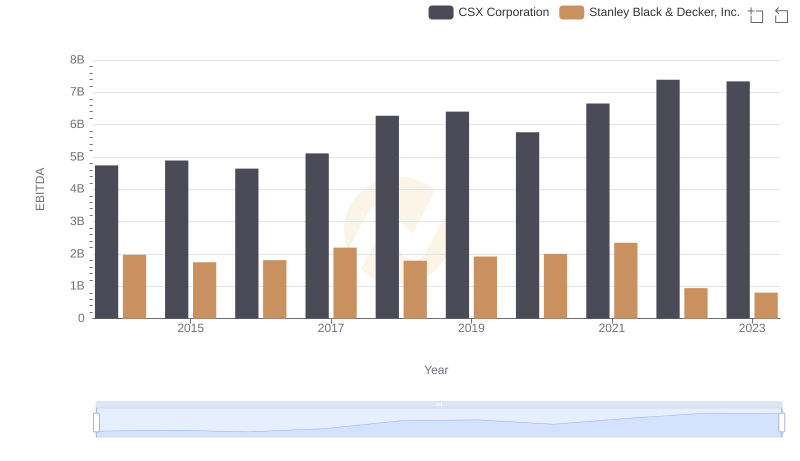
A Professional Review of EBITDA: CSX Corporation Compared to Stanley Black & Decker, Inc.
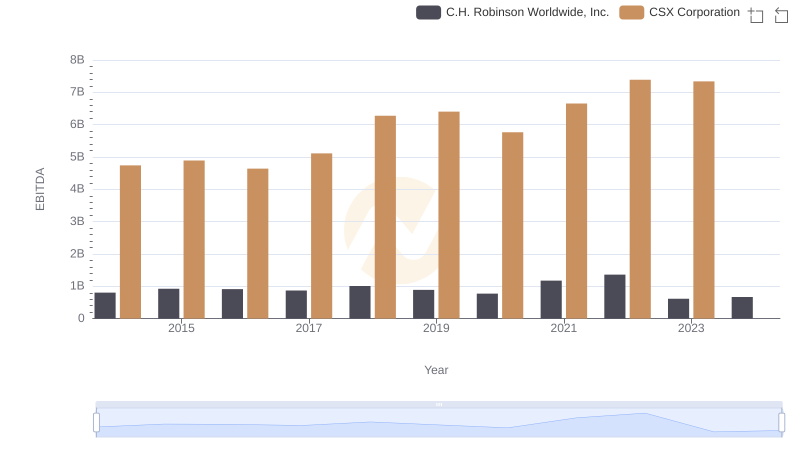
A Professional Review of EBITDA: CSX Corporation Compared to C.H. Robinson Worldwide, Inc.
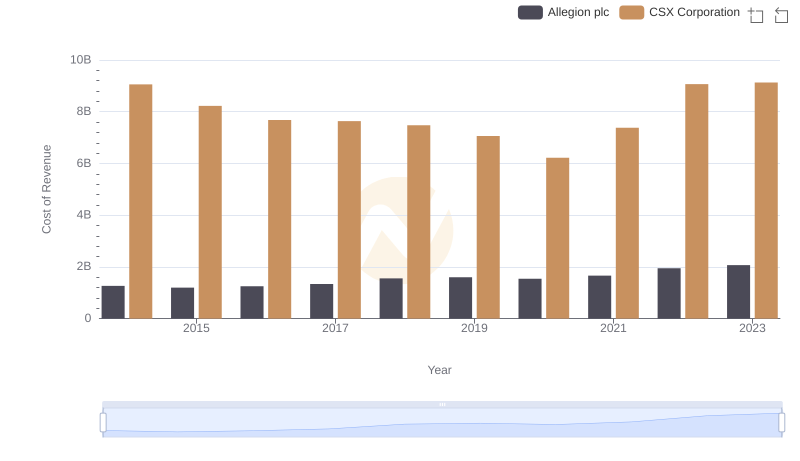
CSX Corporation vs Allegion plc: Efficiency in Cost of Revenue Explored
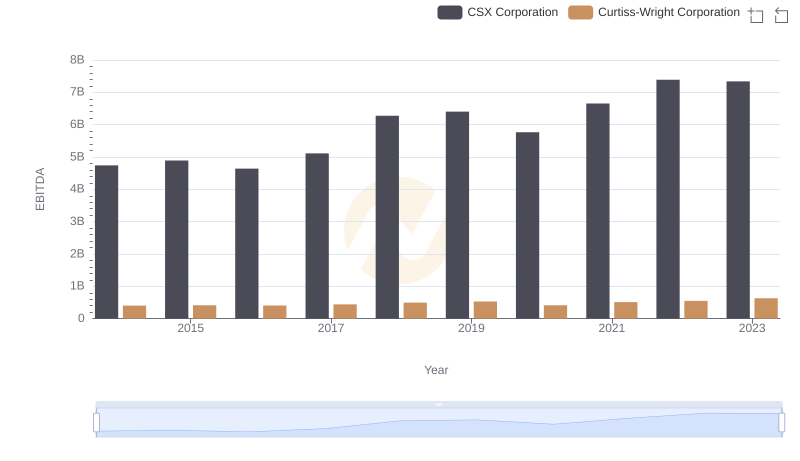
CSX Corporation and Curtiss-Wright Corporation: A Detailed Examination of EBITDA Performance
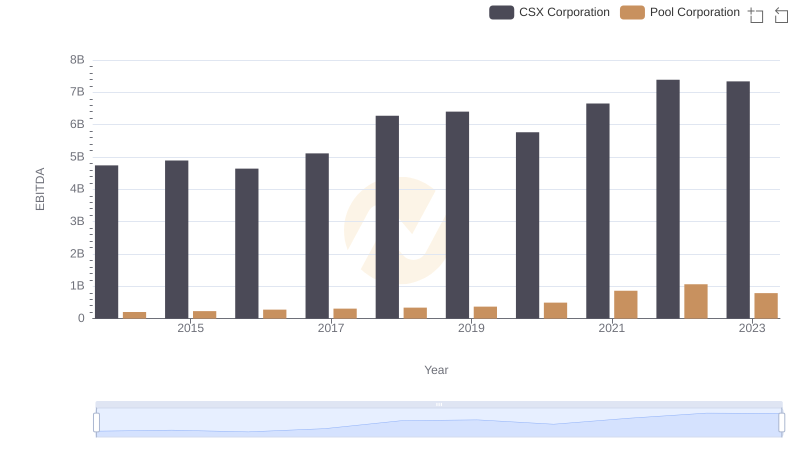
EBITDA Performance Review: CSX Corporation vs Pool Corporation
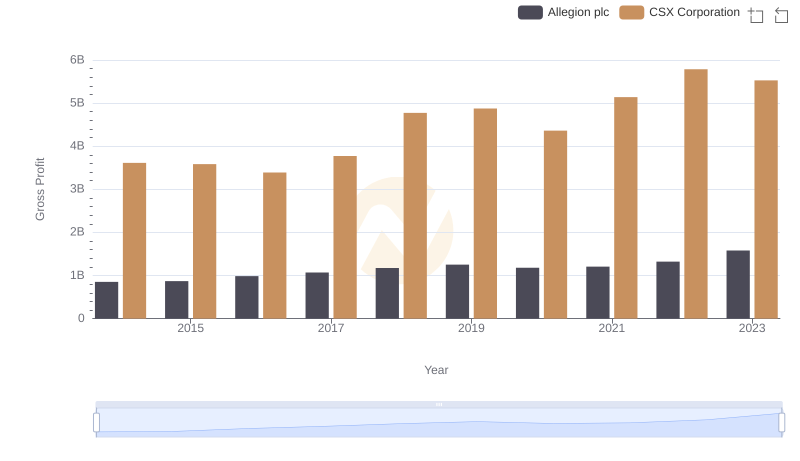
Gross Profit Trends Compared: CSX Corporation vs Allegion plc
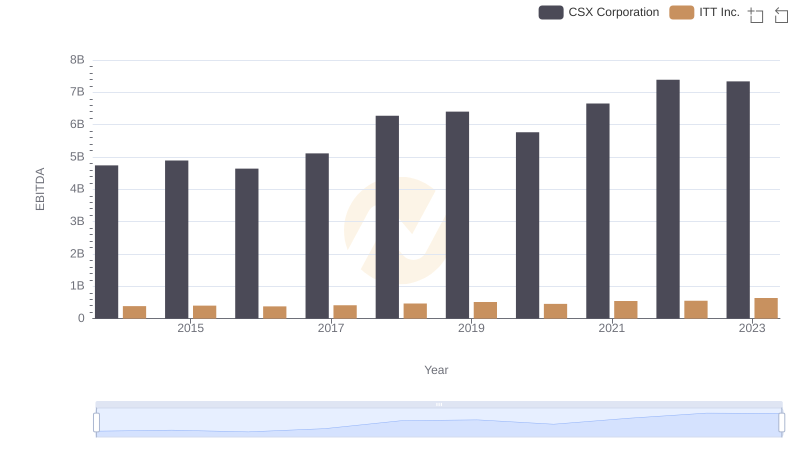
CSX Corporation and ITT Inc.: A Detailed Examination of EBITDA Performance
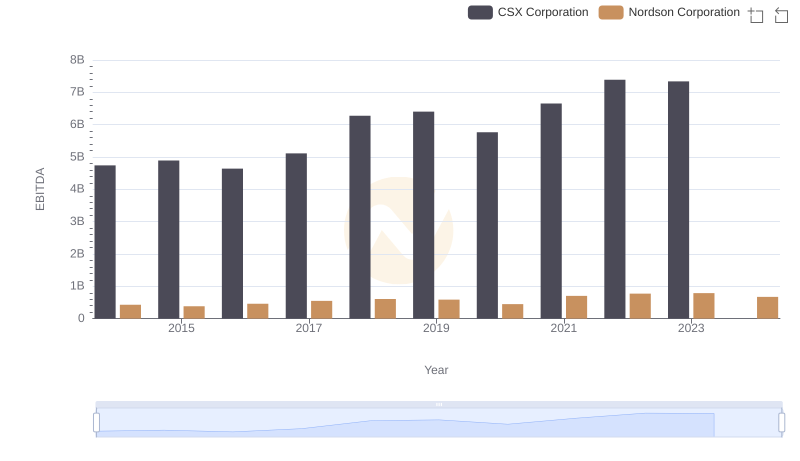
A Professional Review of EBITDA: CSX Corporation Compared to Nordson Corporation
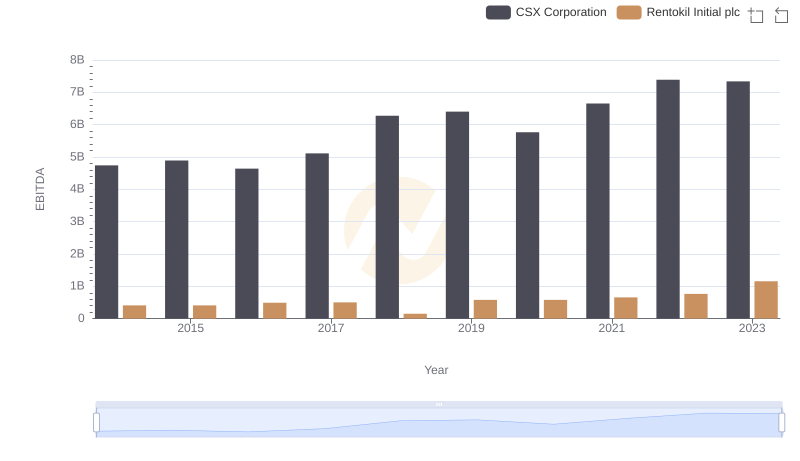
Professional EBITDA Benchmarking: CSX Corporation vs Rentokil Initial plc

A Side-by-Side Analysis of EBITDA: CSX Corporation and TFI International Inc.