| __timestamp | Cintas Corporation | RB Global, Inc. |
|---|---|---|
| Wednesday, January 1, 2014 | 793811000 | 178851000 |
| Thursday, January 1, 2015 | 877761000 | 211417000 |
| Friday, January 1, 2016 | 933728000 | 174791291 |
| Sunday, January 1, 2017 | 968293000 | 168379000 |
| Monday, January 1, 2018 | 1227852000 | 263653000 |
| Tuesday, January 1, 2019 | 1564228000 | 322140110 |
| Wednesday, January 1, 2020 | 1542737000 | 358617000 |
| Friday, January 1, 2021 | 1773591000 | 339928424 |
| Saturday, January 1, 2022 | 1990046000 | 557399151 |
| Sunday, January 1, 2023 | 2221676000 | 975874087 |
| Monday, January 1, 2024 | 2523857000 | 761100000 |
Cracking the code
In the ever-evolving landscape of corporate finance, EBITDA serves as a crucial indicator of a company's operational efficiency. Over the past decade, Cintas Corporation and RB Global, Inc. have demonstrated contrasting trajectories in their EBITDA performance.
From 2014 to 2023, Cintas Corporation's EBITDA has surged by approximately 218%, reflecting a robust growth strategy and operational excellence. Notably, the company experienced a significant leap in 2023, with EBITDA reaching over 2.2 billion, marking a 12% increase from the previous year.
In contrast, RB Global, Inc. has faced a more volatile path. While the company saw a remarkable 172% increase in EBITDA from 2014 to 2023, the journey was marked by fluctuations, peaking in 2023 with a 75% rise from 2022. However, data for 2024 remains elusive, leaving room for speculation on future performance.
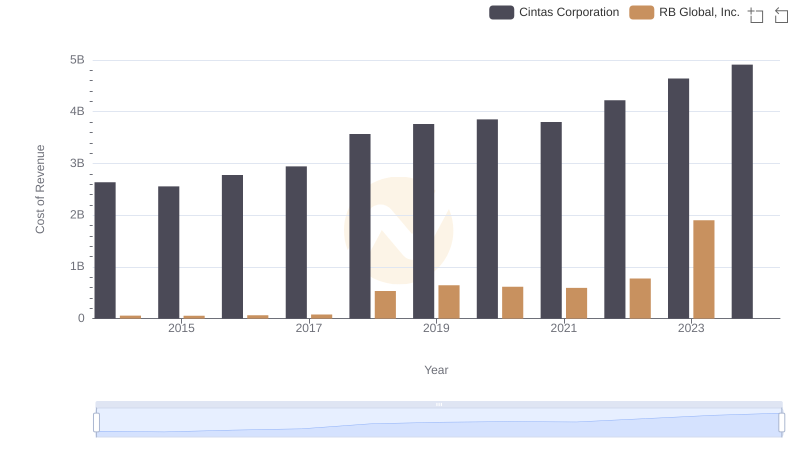
Cintas Corporation vs RB Global, Inc.: Efficiency in Cost of Revenue Explored
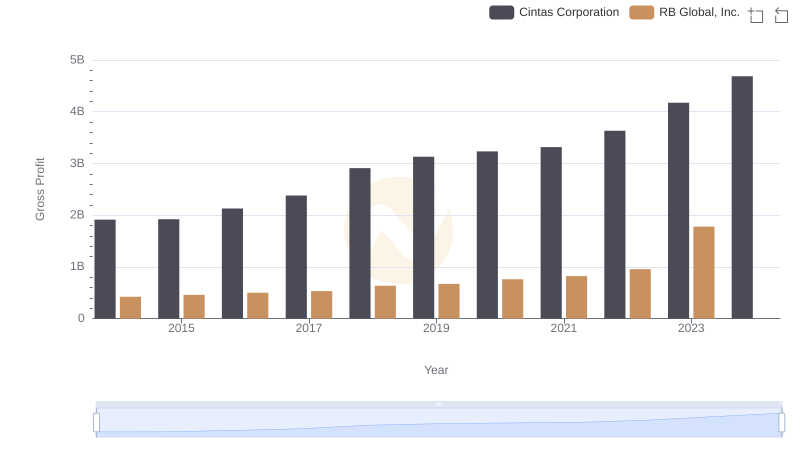
Key Insights on Gross Profit: Cintas Corporation vs RB Global, Inc.
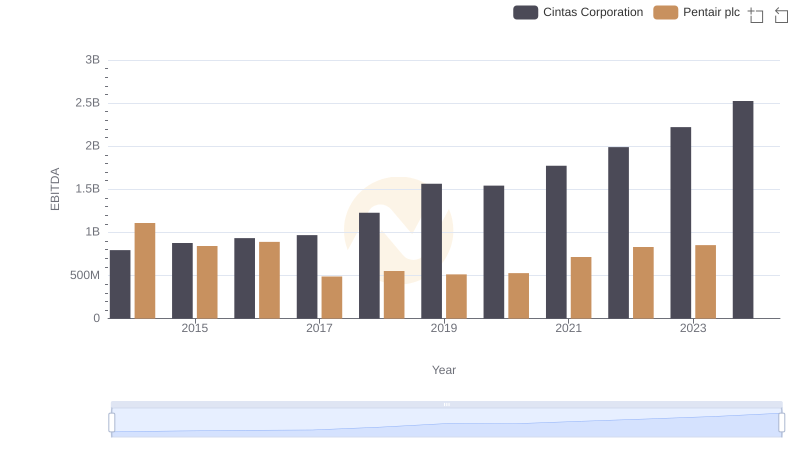
Professional EBITDA Benchmarking: Cintas Corporation vs Pentair plc
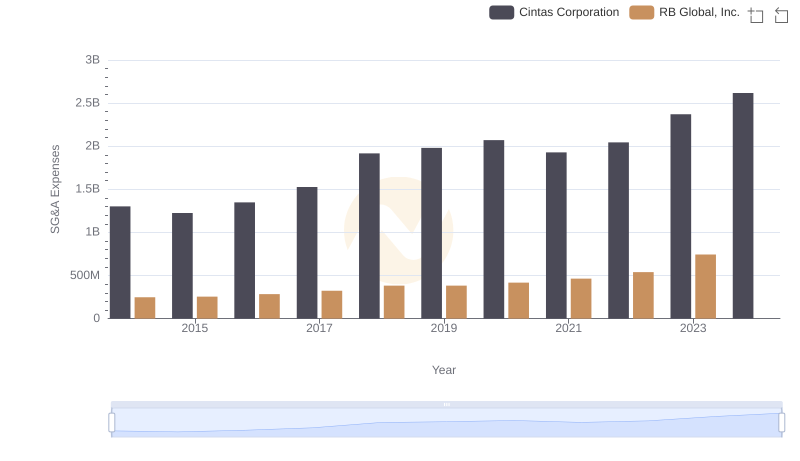
Cintas Corporation and RB Global, Inc.: SG&A Spending Patterns Compared
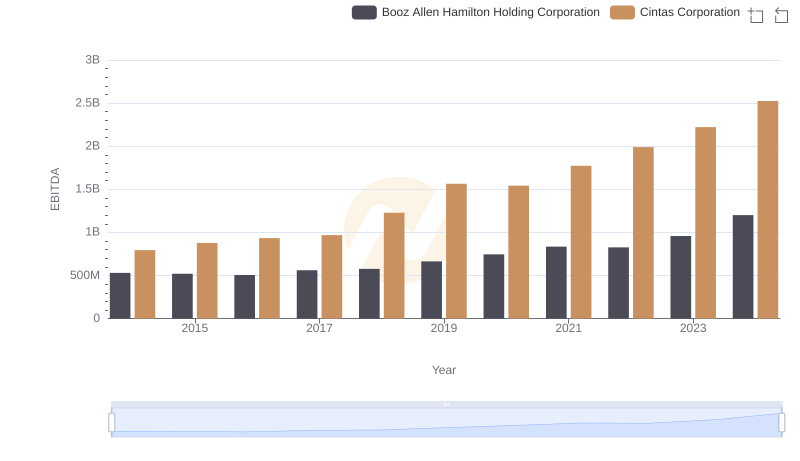
Cintas Corporation and Booz Allen Hamilton Holding Corporation: A Detailed Examination of EBITDA Performance
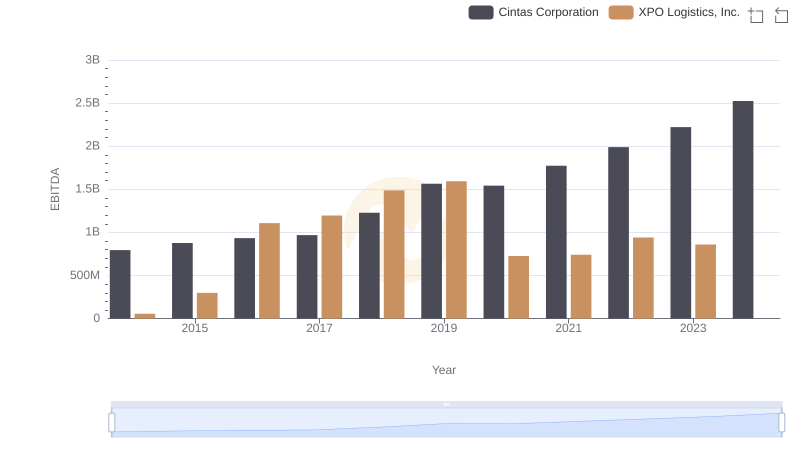
Cintas Corporation and XPO Logistics, Inc.: A Detailed Examination of EBITDA Performance
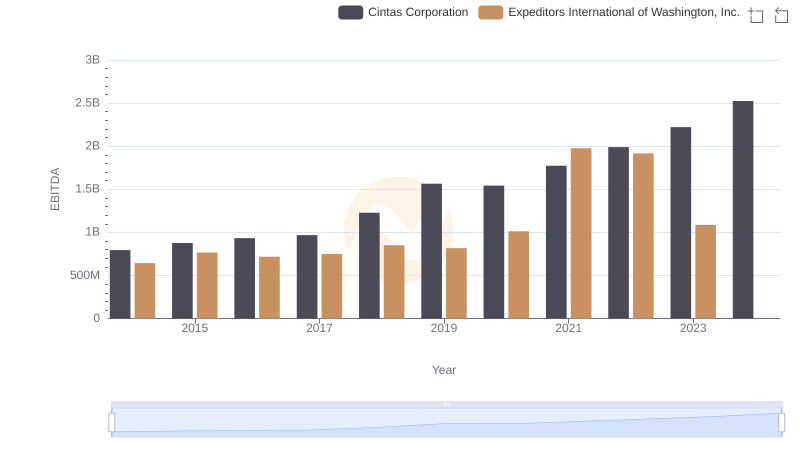
EBITDA Analysis: Evaluating Cintas Corporation Against Expeditors International of Washington, Inc.
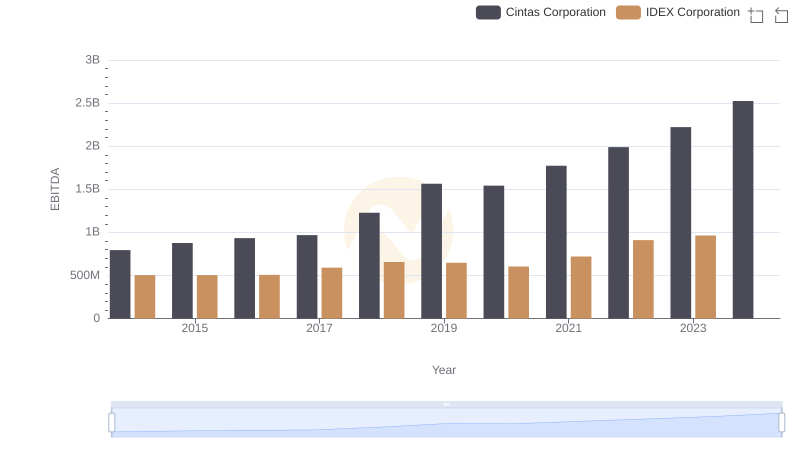
A Side-by-Side Analysis of EBITDA: Cintas Corporation and IDEX Corporation
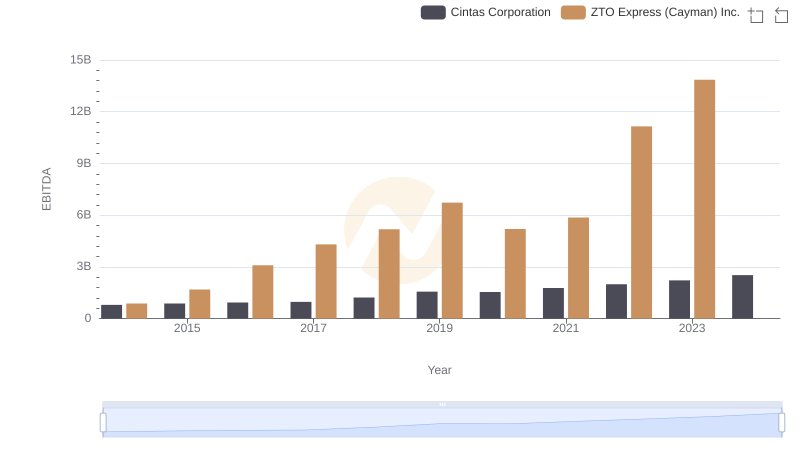
A Side-by-Side Analysis of EBITDA: Cintas Corporation and ZTO Express (Cayman) Inc.