| __timestamp | AMETEK, Inc. | Global Payments Inc. |
|---|---|---|
| Wednesday, January 1, 2014 | 4021964000 | 2773718000 |
| Thursday, January 1, 2015 | 3974295000 | 2898150000 |
| Friday, January 1, 2016 | 3840087000 | 3370976000 |
| Sunday, January 1, 2017 | 4300170000 | 3975163000 |
| Monday, January 1, 2018 | 4845872000 | 3366366000 |
| Tuesday, January 1, 2019 | 5158557000 | 4911892000 |
| Wednesday, January 1, 2020 | 4540029000 | 7423558000 |
| Friday, January 1, 2021 | 5546514000 | 8523762000 |
| Saturday, January 1, 2022 | 6150530000 | 8975515000 |
| Sunday, January 1, 2023 | 6596950000 | 9654419000 |
| Monday, January 1, 2024 | 6941180000 | 10105894000 |
Unleashing the power of data
In the ever-evolving landscape of global business, AMETEK, Inc. and Global Payments Inc. have emerged as formidable players. Over the past decade, these companies have demonstrated remarkable growth in their annual revenues. From 2014 to 2023, AMETEK, Inc. saw its revenue grow by approximately 64%, while Global Payments Inc. experienced an impressive 248% increase.
In 2014, AMETEK, Inc. led with a revenue of $4 billion, but by 2023, Global Payments Inc. had surged ahead, boasting a revenue of nearly $9.7 billion. This shift highlights the dynamic nature of the industry and the strategic maneuvers by Global Payments Inc. to capture market share.
As we look to the future, the question remains: Can AMETEK, Inc. reclaim its lead, or will Global Payments Inc. continue its upward trajectory? Only time will tell.
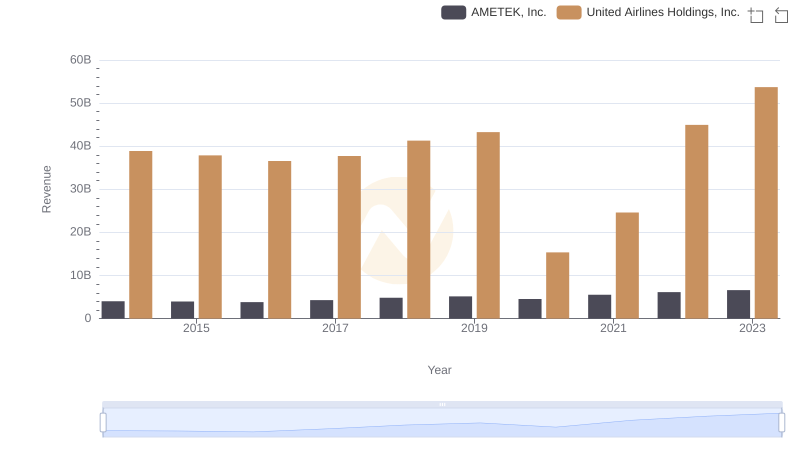
Breaking Down Revenue Trends: AMETEK, Inc. vs United Airlines Holdings, Inc.
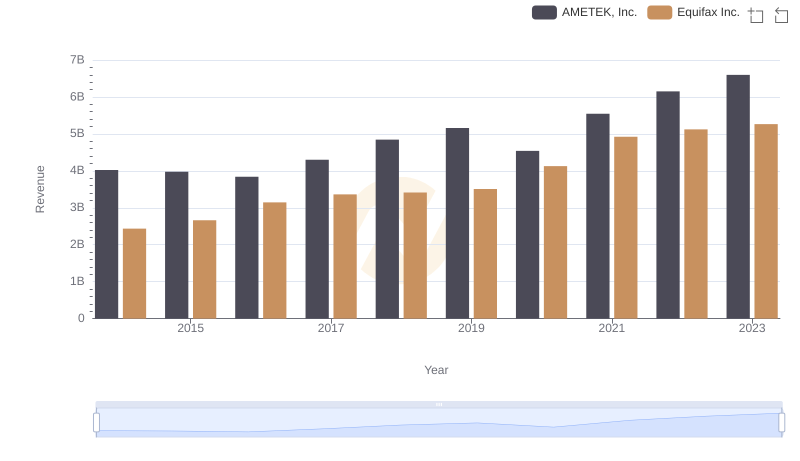
AMETEK, Inc. or Equifax Inc.: Who Leads in Yearly Revenue?
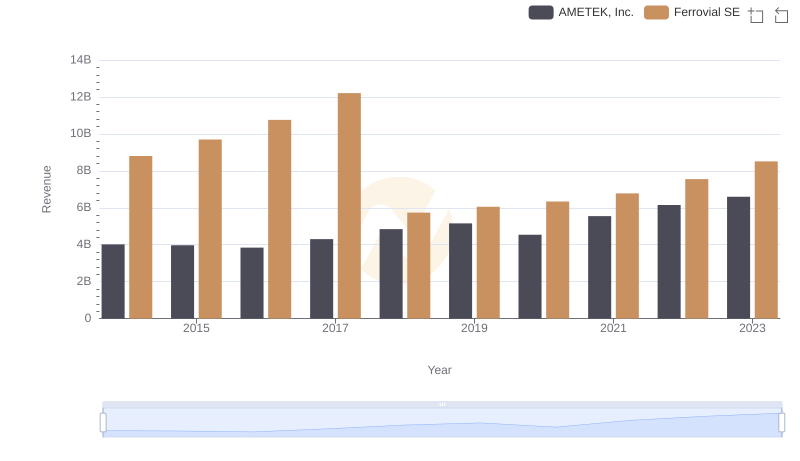
AMETEK, Inc. or Ferrovial SE: Who Leads in Yearly Revenue?
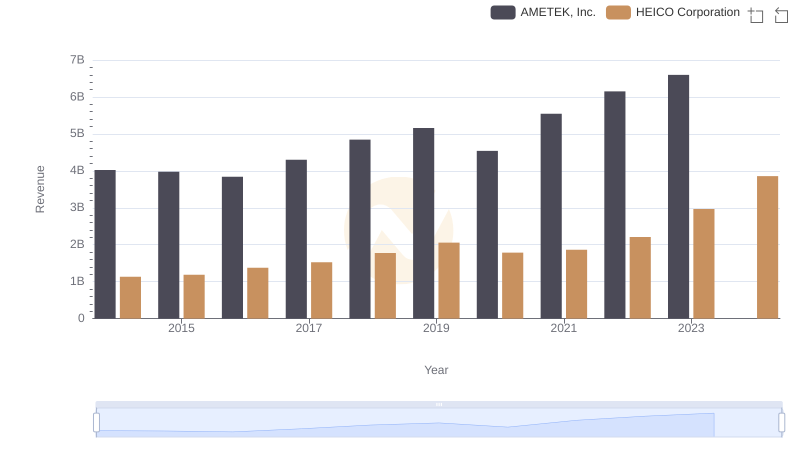
AMETEK, Inc. and HEICO Corporation: A Comprehensive Revenue Analysis
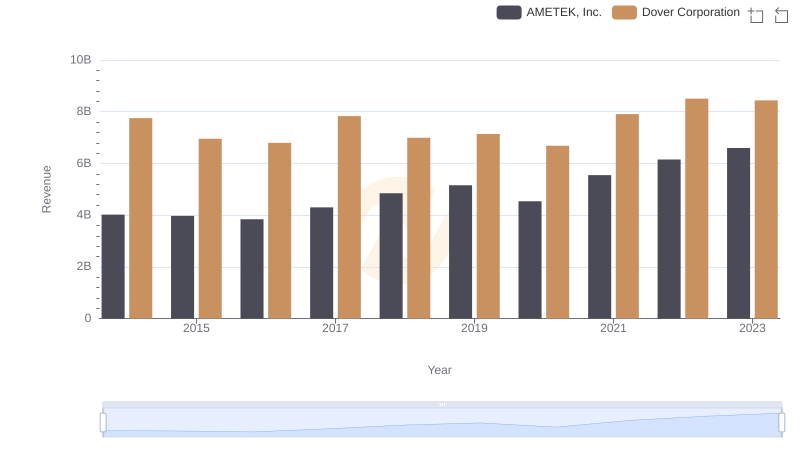
AMETEK, Inc. vs Dover Corporation: Examining Key Revenue Metrics
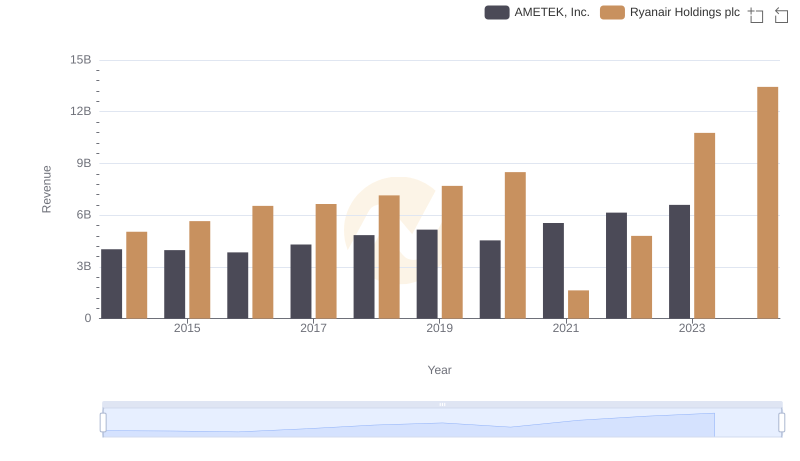
AMETEK, Inc. vs Ryanair Holdings plc: Examining Key Revenue Metrics
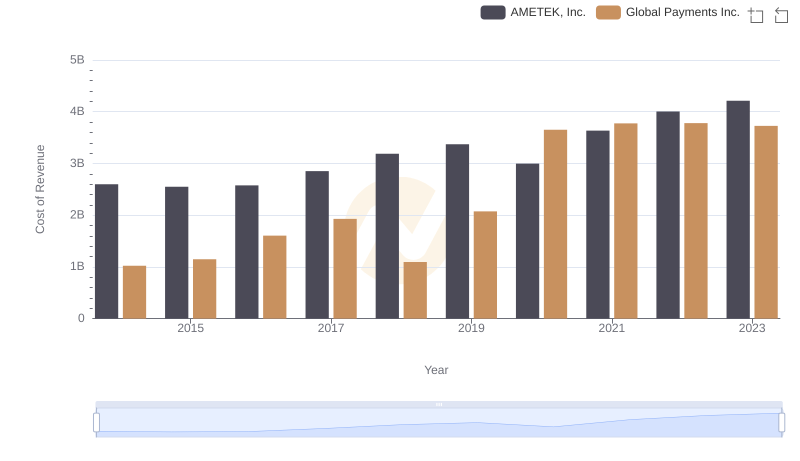
Cost of Revenue Comparison: AMETEK, Inc. vs Global Payments Inc.
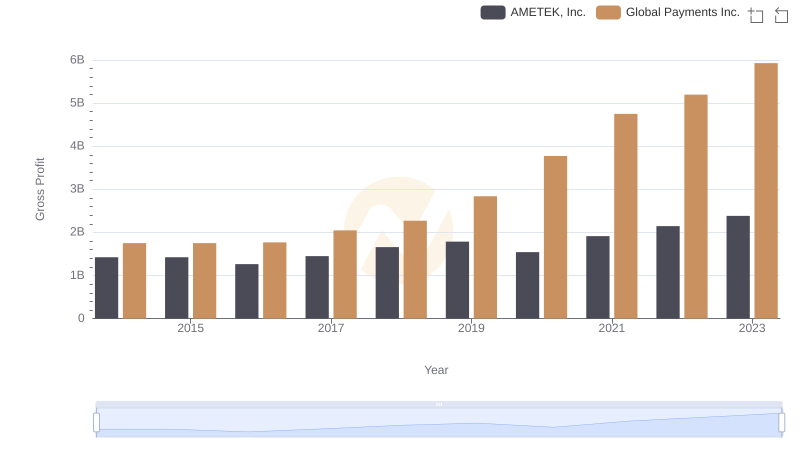
AMETEK, Inc. vs Global Payments Inc.: A Gross Profit Performance Breakdown
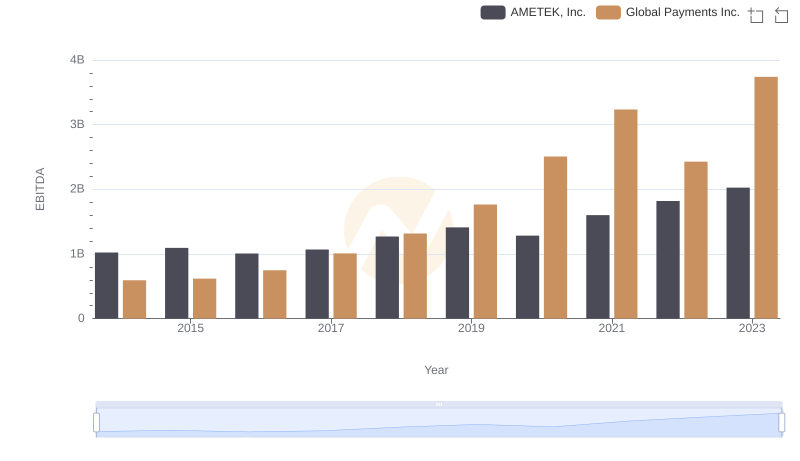
A Side-by-Side Analysis of EBITDA: AMETEK, Inc. and Global Payments Inc.