| __timestamp | AMETEK, Inc. | Global Payments Inc. |
|---|---|---|
| Wednesday, January 1, 2014 | 2597017000 | 1022107000 |
| Thursday, January 1, 2015 | 2549280000 | 1147639000 |
| Friday, January 1, 2016 | 2575220000 | 1603532000 |
| Sunday, January 1, 2017 | 2851431000 | 1928037000 |
| Monday, January 1, 2018 | 3186310000 | 1095014000 |
| Tuesday, January 1, 2019 | 3370897000 | 2073803000 |
| Wednesday, January 1, 2020 | 2996515000 | 3650727000 |
| Friday, January 1, 2021 | 3633900000 | 3773725000 |
| Saturday, January 1, 2022 | 4005261000 | 3778617000 |
| Sunday, January 1, 2023 | 4212484999 | 3727521000 |
| Monday, January 1, 2024 | 0 | 3760116000 |
Unveiling the hidden dimensions of data
In the ever-evolving landscape of the financial sector, AMETEK, Inc. and Global Payments Inc. have emerged as key players. Over the past decade, these companies have demonstrated contrasting trends in their cost of revenue, a critical metric that reflects the direct costs attributable to the production of goods sold by a company.
From 2014 to 2023, AMETEK, Inc. has seen a steady increase in its cost of revenue, growing by approximately 62% from 2014 to 2023. This upward trajectory highlights AMETEK's expanding operations and possibly its strategic investments in production capabilities. In contrast, Global Payments Inc. experienced a more volatile journey, with a significant spike in 2020, where costs surged by over 80% compared to 2014, before stabilizing in subsequent years.
These trends underscore the dynamic nature of the industry and the strategic decisions that shape the financial health of these corporations.
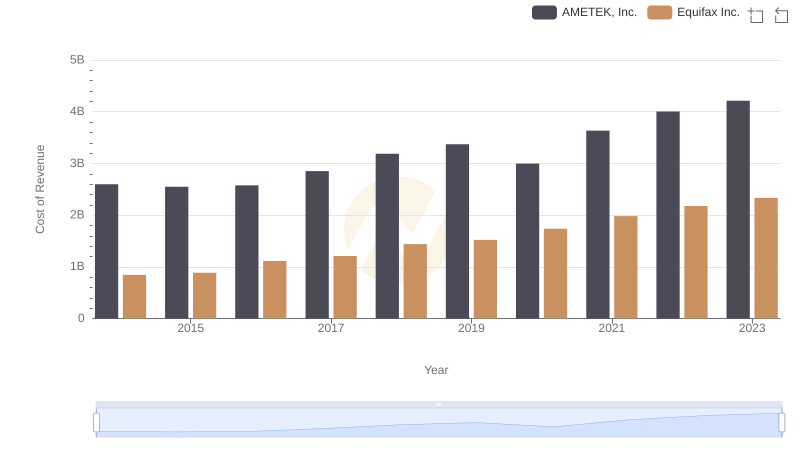
AMETEK, Inc. vs Equifax Inc.: Efficiency in Cost of Revenue Explored
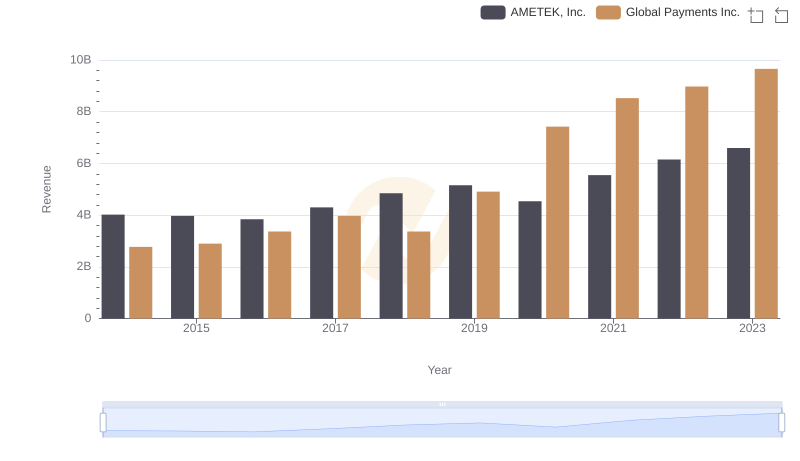
AMETEK, Inc. or Global Payments Inc.: Who Leads in Yearly Revenue?
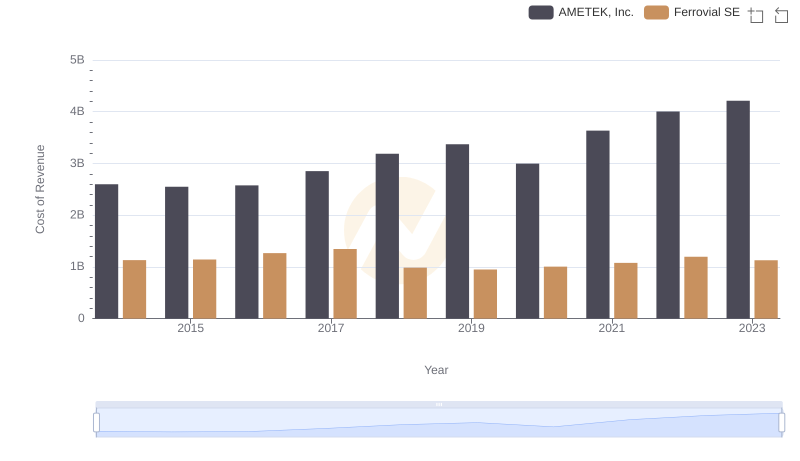
Cost of Revenue Trends: AMETEK, Inc. vs Ferrovial SE
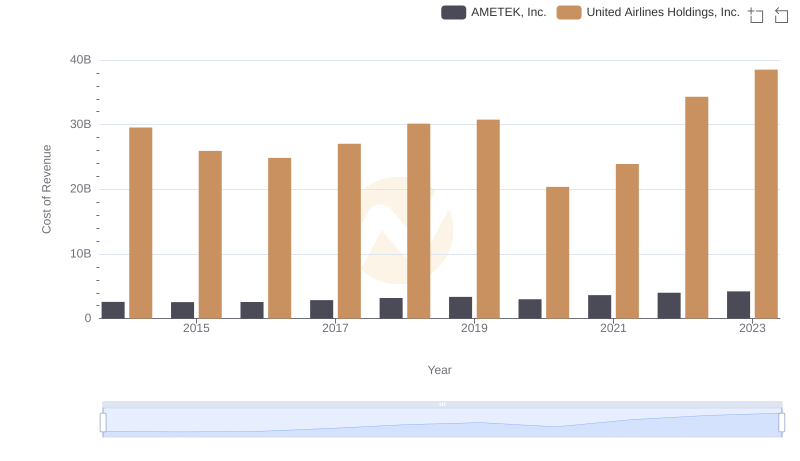
Cost of Revenue Trends: AMETEK, Inc. vs United Airlines Holdings, Inc.
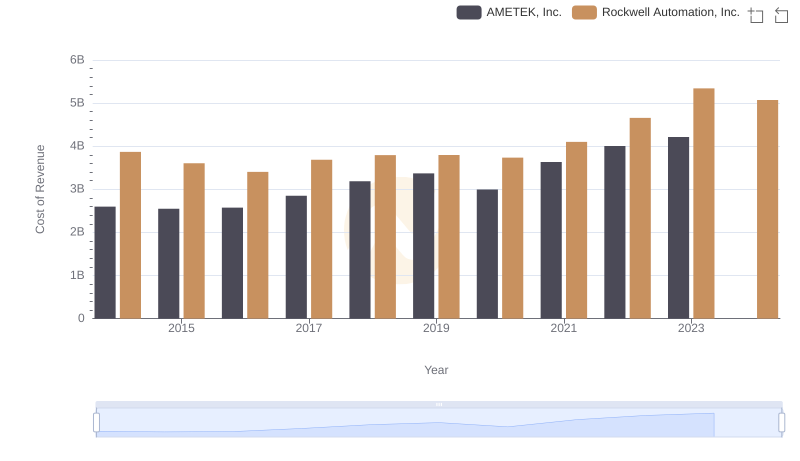
Cost of Revenue Trends: AMETEK, Inc. vs Rockwell Automation, Inc.
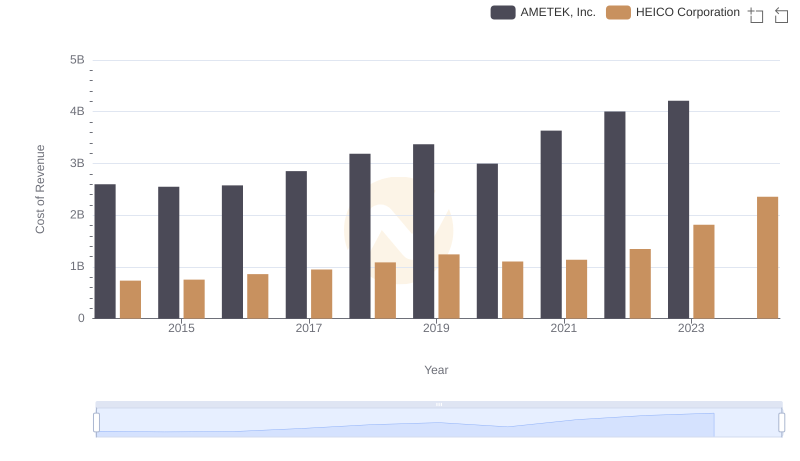
Cost of Revenue Comparison: AMETEK, Inc. vs HEICO Corporation
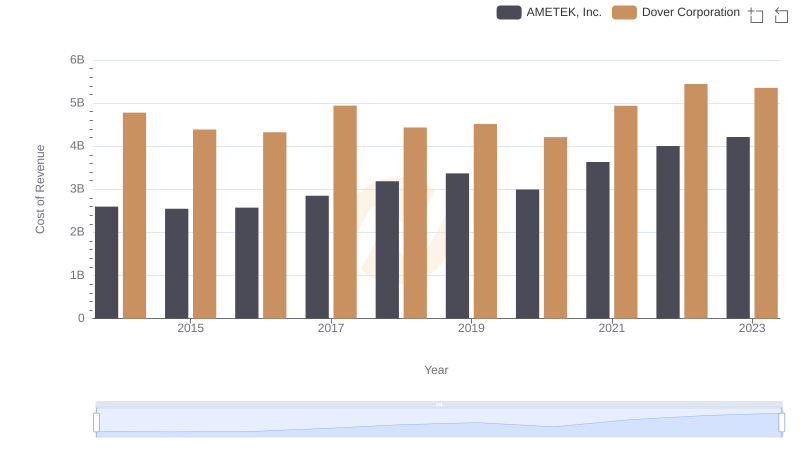
Cost of Revenue: Key Insights for AMETEK, Inc. and Dover Corporation
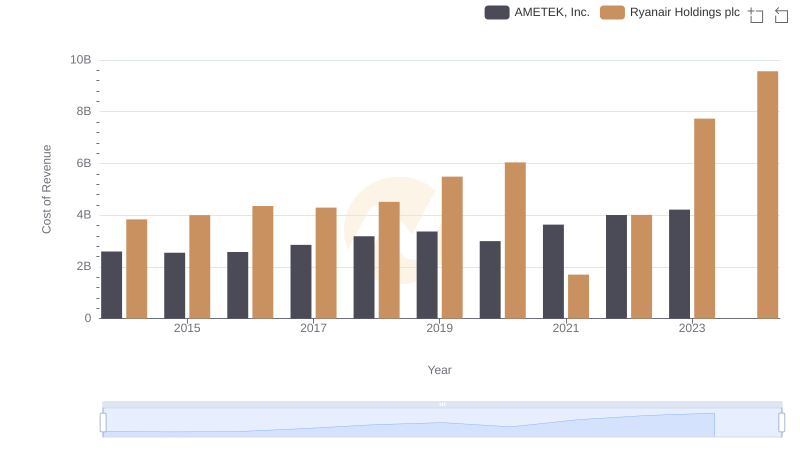
AMETEK, Inc. vs Ryanair Holdings plc: Efficiency in Cost of Revenue Explored
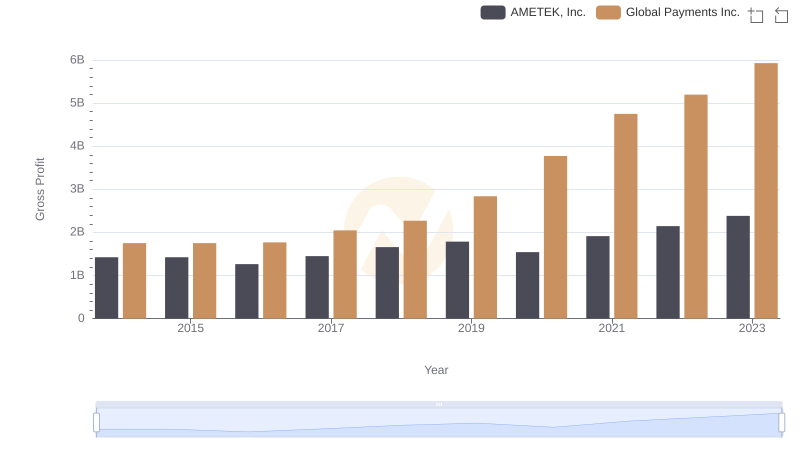
AMETEK, Inc. vs Global Payments Inc.: A Gross Profit Performance Breakdown
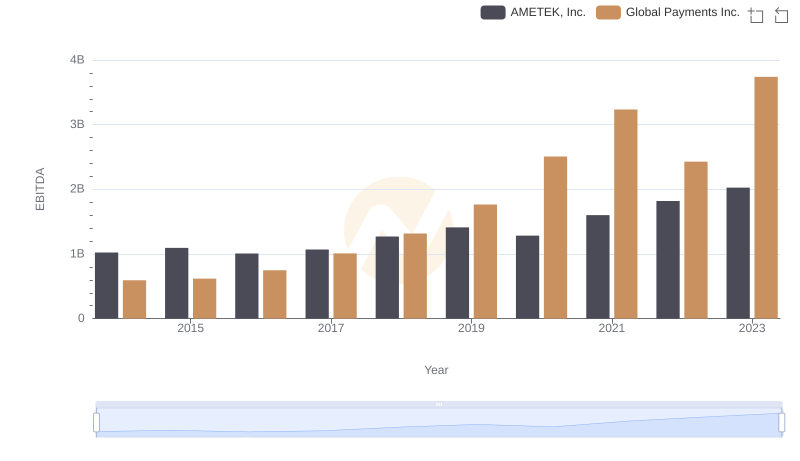
A Side-by-Side Analysis of EBITDA: AMETEK, Inc. and Global Payments Inc.