| __timestamp | FedEx Corporation | Waste Management, Inc. |
|---|---|---|
| Wednesday, January 1, 2014 | 6036000000 | 3509000000 |
| Thursday, January 1, 2015 | 7141000000 | 3342000000 |
| Friday, January 1, 2016 | 7531000000 | 3713000000 |
| Sunday, January 1, 2017 | 8093000000 | 3996000000 |
| Monday, January 1, 2018 | 8555000000 | 4212000000 |
| Tuesday, January 1, 2019 | 4934000000 | 4344000000 |
| Wednesday, January 1, 2020 | 6345000000 | 4149000000 |
| Friday, January 1, 2021 | 11749000000 | 4956000000 |
| Saturday, January 1, 2022 | 9767000000 | 5466000000 |
| Sunday, January 1, 2023 | 10603000000 | 5592000000 |
| Monday, January 1, 2024 | 10868000000 | 5128000000 |
Cracking the code
In the ever-evolving landscape of corporate finance, EBITDA serves as a crucial metric for evaluating a company's operational performance. This analysis juxtaposes the EBITDA of Waste Management, Inc. and FedEx Corporation from 2014 to 2023, offering a decade-long perspective on their financial health.
FedEx Corporation has demonstrated a robust growth trajectory, with its EBITDA surging by approximately 76% from 2014 to 2023. Notably, 2021 marked a peak year, with FedEx achieving an EBITDA of over $11 billion, reflecting its strategic resilience amidst global challenges. In contrast, Waste Management, Inc. exhibited a steady yet modest growth, with its EBITDA increasing by around 59% over the same period. The data for 2024 remains incomplete, highlighting the dynamic nature of financial forecasting.
This comparative analysis underscores the diverse strategies and market conditions influencing these industry giants, offering valuable insights for investors and stakeholders.
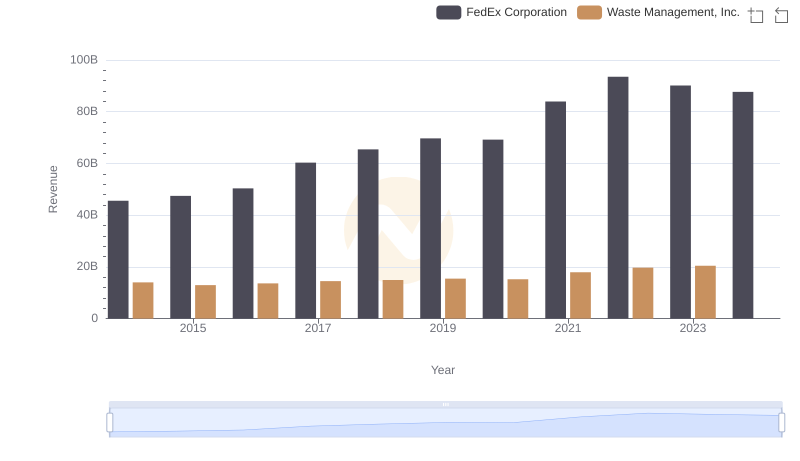
Waste Management, Inc. or FedEx Corporation: Who Leads in Yearly Revenue?
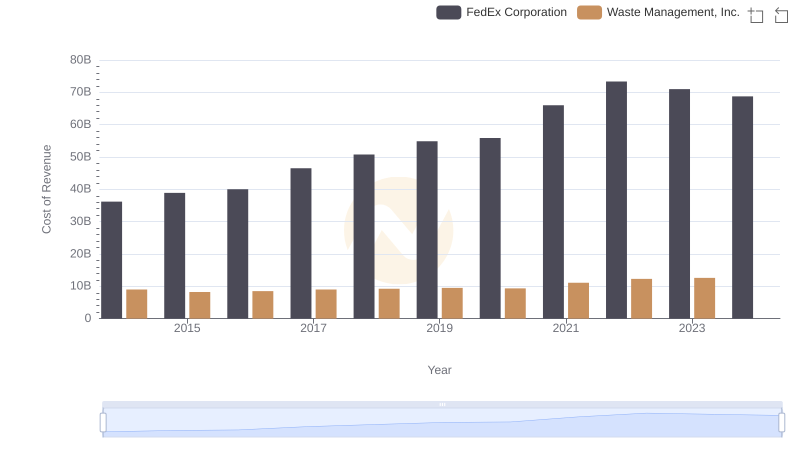
Comparing Cost of Revenue Efficiency: Waste Management, Inc. vs FedEx Corporation
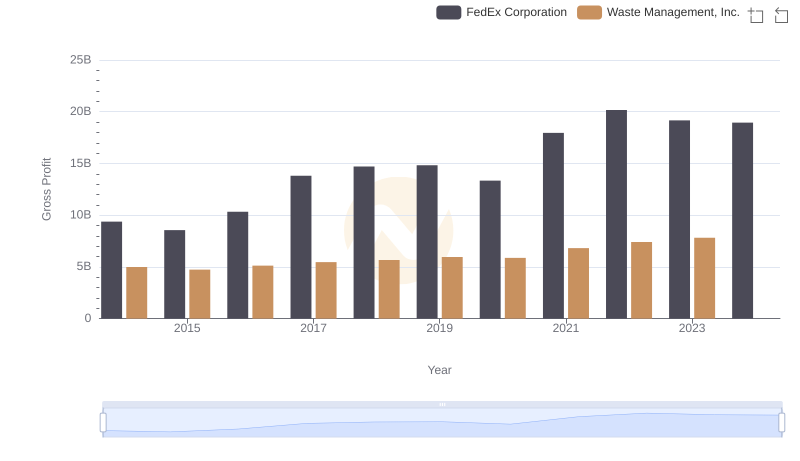
Gross Profit Analysis: Comparing Waste Management, Inc. and FedEx Corporation
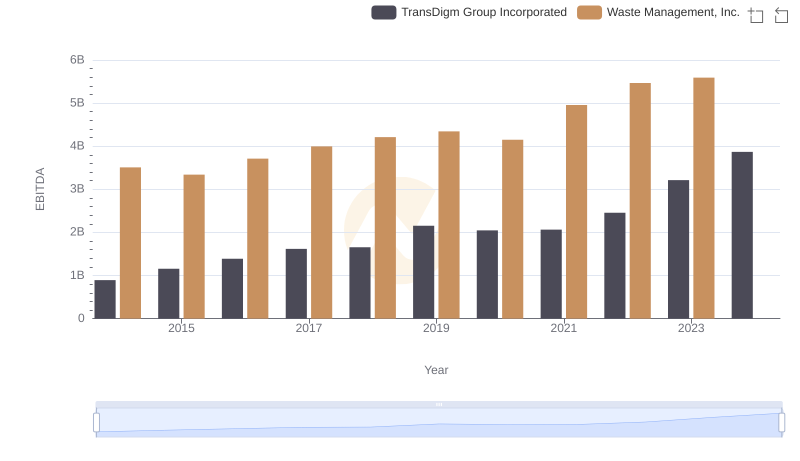
Waste Management, Inc. vs TransDigm Group Incorporated: In-Depth EBITDA Performance Comparison
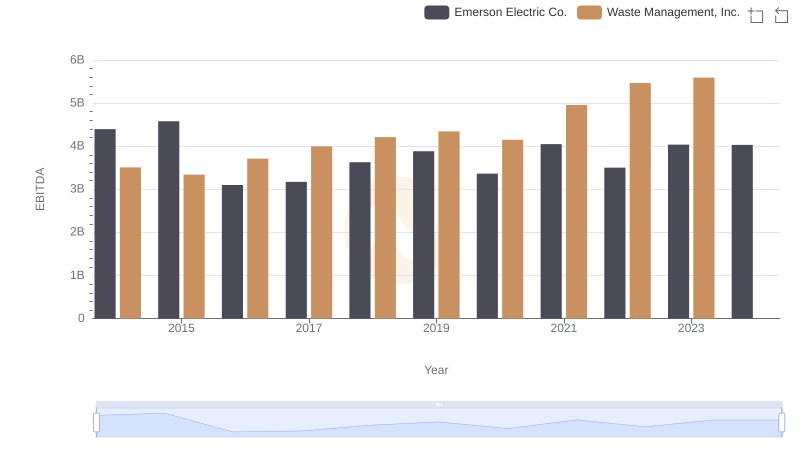
A Side-by-Side Analysis of EBITDA: Waste Management, Inc. and Emerson Electric Co.
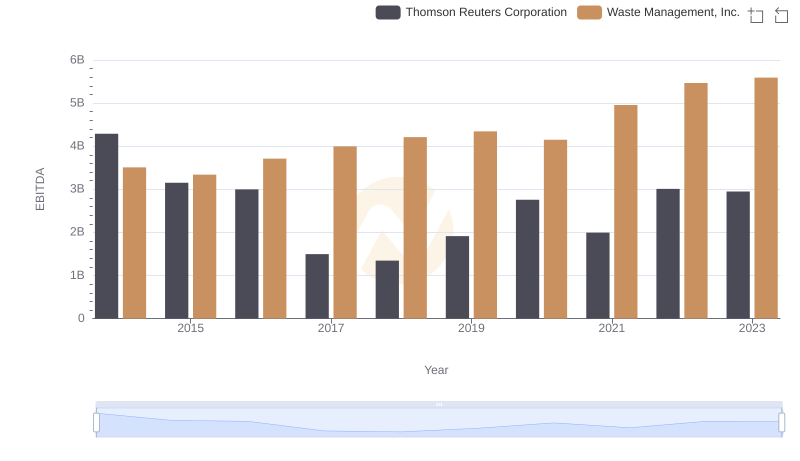
EBITDA Performance Review: Waste Management, Inc. vs Thomson Reuters Corporation
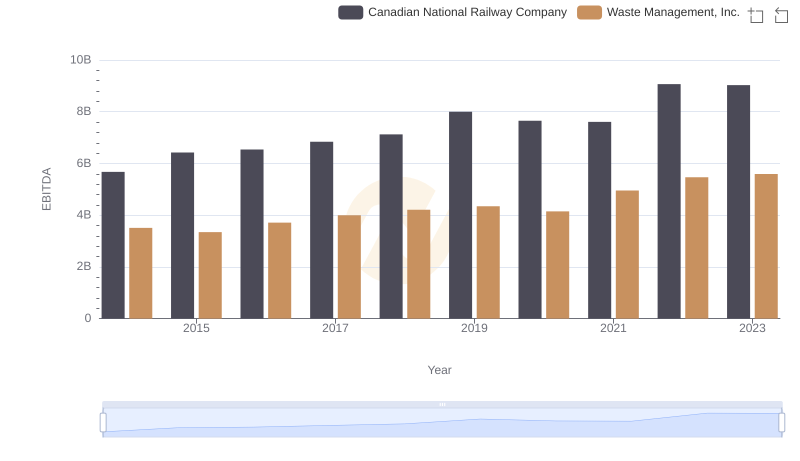
Comparative EBITDA Analysis: Waste Management, Inc. vs Canadian National Railway Company
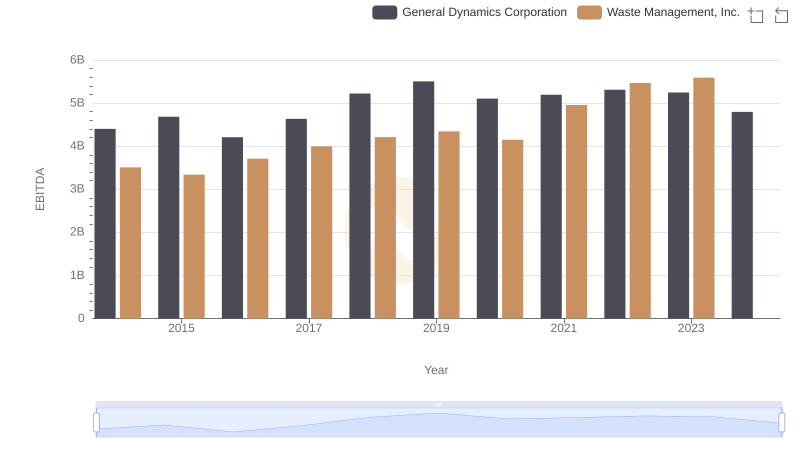
Comprehensive EBITDA Comparison: Waste Management, Inc. vs General Dynamics Corporation
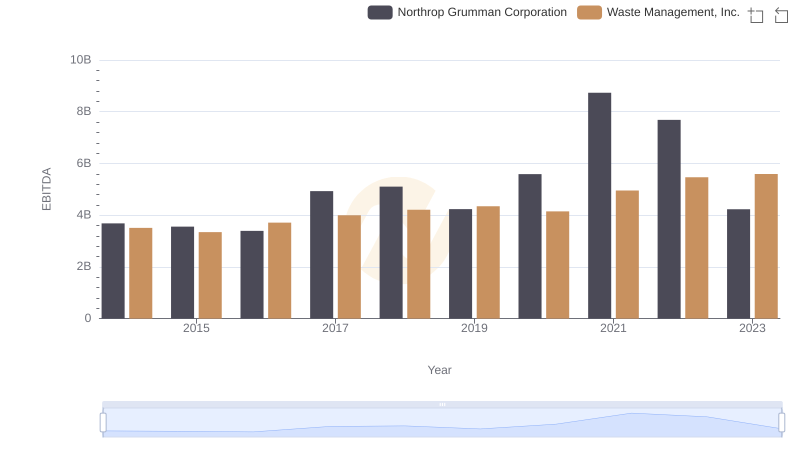
Waste Management, Inc. and Northrop Grumman Corporation: A Detailed Examination of EBITDA Performance
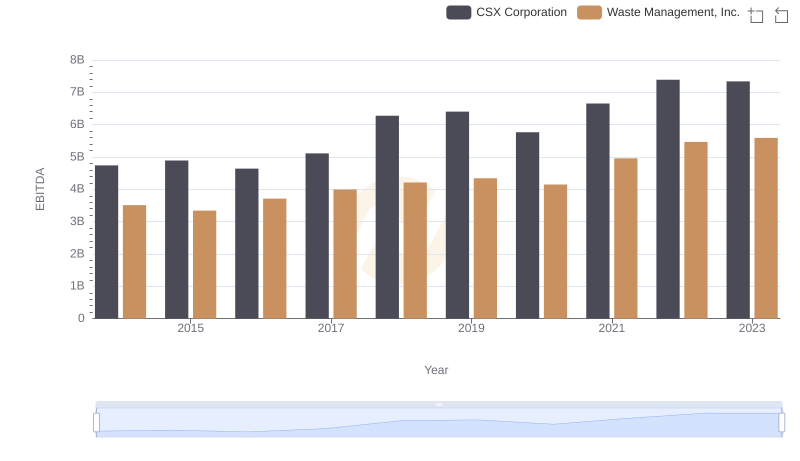
A Professional Review of EBITDA: Waste Management, Inc. Compared to CSX Corporation