| __timestamp | General Dynamics Corporation | Waste Management, Inc. |
|---|---|---|
| Wednesday, January 1, 2014 | 4401000000 | 3509000000 |
| Thursday, January 1, 2015 | 4682000000 | 3342000000 |
| Friday, January 1, 2016 | 4208000000 | 3713000000 |
| Sunday, January 1, 2017 | 4635000000 | 3996000000 |
| Monday, January 1, 2018 | 5222000000 | 4212000000 |
| Tuesday, January 1, 2019 | 5503000000 | 4344000000 |
| Wednesday, January 1, 2020 | 5105000000 | 4149000000 |
| Friday, January 1, 2021 | 5194000000 | 4956000000 |
| Saturday, January 1, 2022 | 5311000000 | 5466000000 |
| Sunday, January 1, 2023 | 5246000000 | 5592000000 |
| Monday, January 1, 2024 | 5819000000 | 5128000000 |
Igniting the spark of knowledge
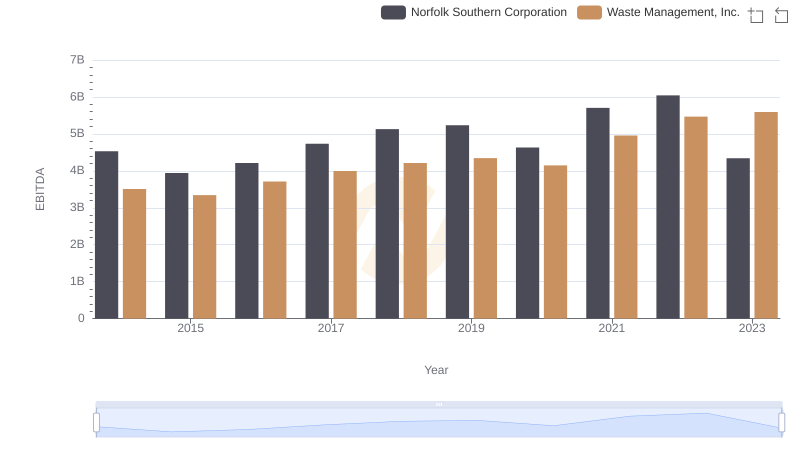
In the ever-evolving landscape of American industry, Waste Management, Inc. and General Dynamics Corporation stand as titans in their respective fields. Over the past decade, from 2014 to 2023, these companies have showcased their financial prowess through EBITDA performance. General Dynamics, a leader in aerospace and defense, consistently maintained a robust EBITDA, peaking in 2019 with a 25% increase from 2014. Meanwhile, Waste Management, a stalwart in environmental services, demonstrated remarkable growth, with a 59% rise in EBITDA by 2023, surpassing General Dynamics in recent years.
This financial journey highlights the resilience and adaptability of these corporations amidst economic fluctuations. Notably, Waste Management's EBITDA surged past General Dynamics in 2022, marking a pivotal shift. However, data for 2024 remains incomplete, leaving room for speculation on future trends. This comparison underscores the dynamic nature of industry leaders and their strategic maneuvers in a competitive market.
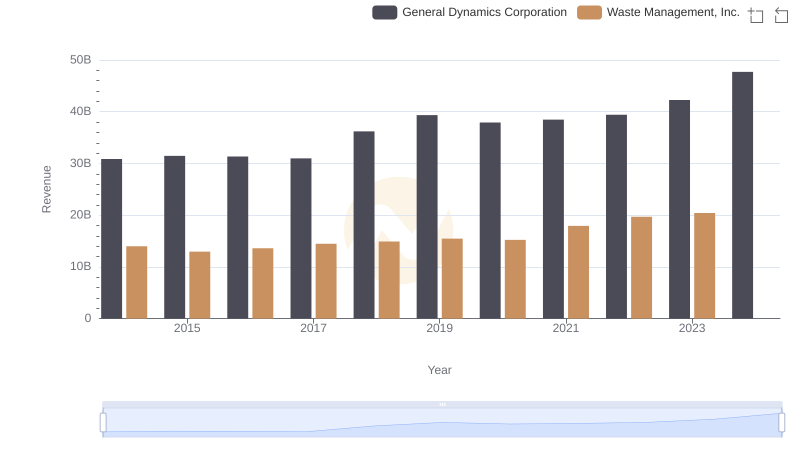
Revenue Insights: Waste Management, Inc. and General Dynamics Corporation Performance Compared
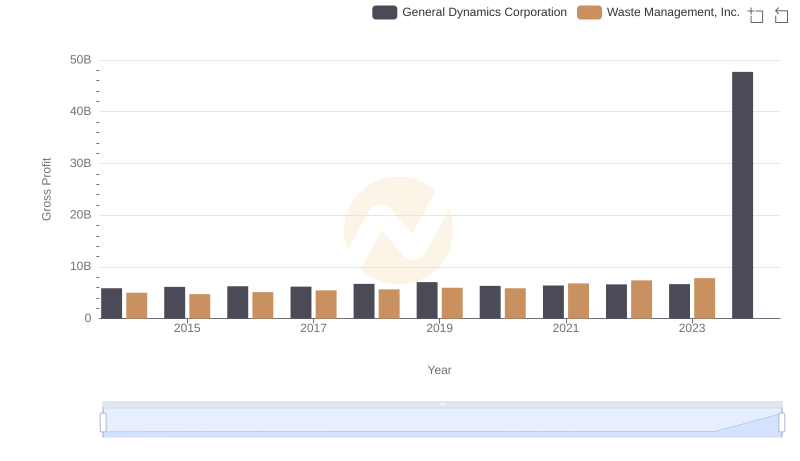
Gross Profit Trends Compared: Waste Management, Inc. vs General Dynamics Corporation
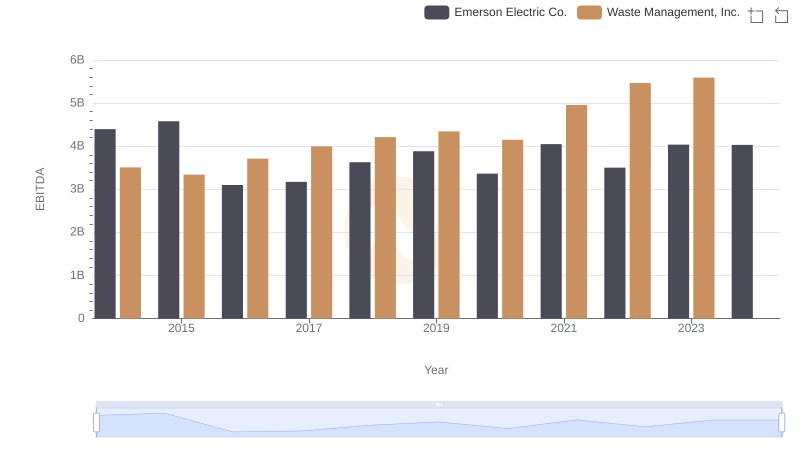
A Side-by-Side Analysis of EBITDA: Waste Management, Inc. and Emerson Electric Co.
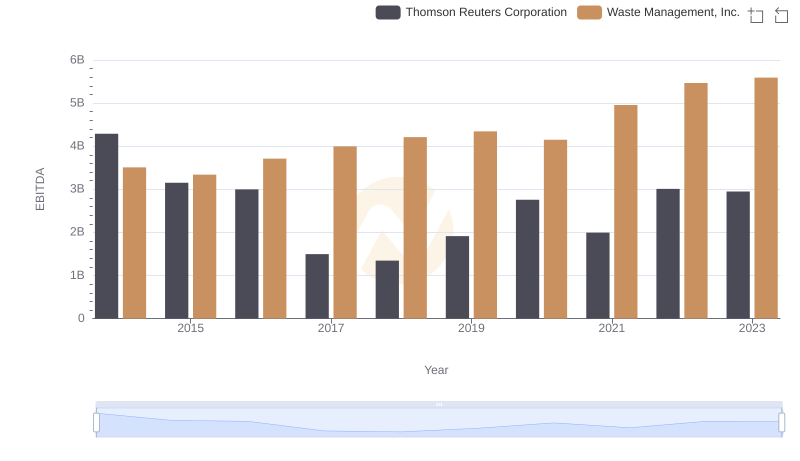
EBITDA Performance Review: Waste Management, Inc. vs Thomson Reuters Corporation

Professional EBITDA Benchmarking: Waste Management, Inc. vs FedEx Corporation
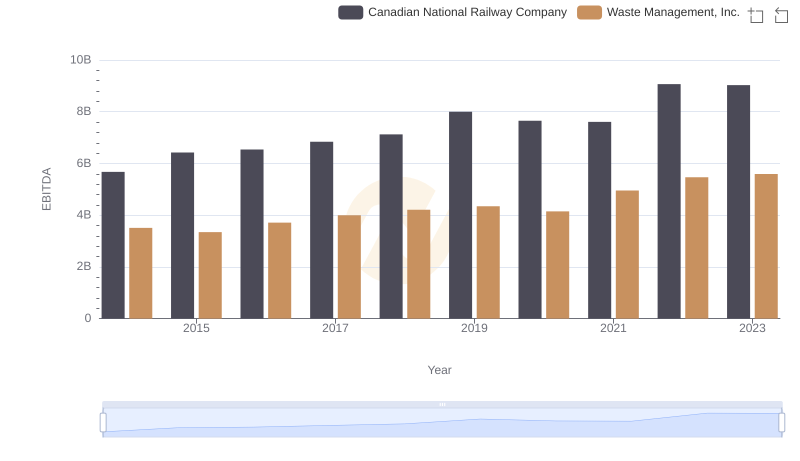
Comparative EBITDA Analysis: Waste Management, Inc. vs Canadian National Railway Company
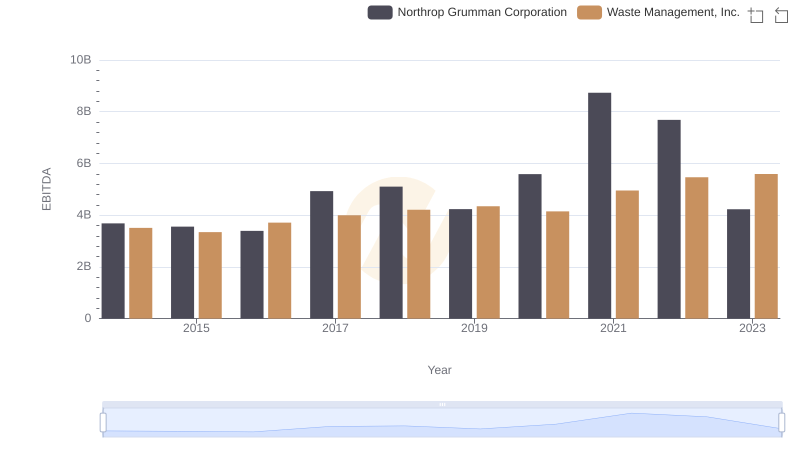
Waste Management, Inc. and Northrop Grumman Corporation: A Detailed Examination of EBITDA Performance
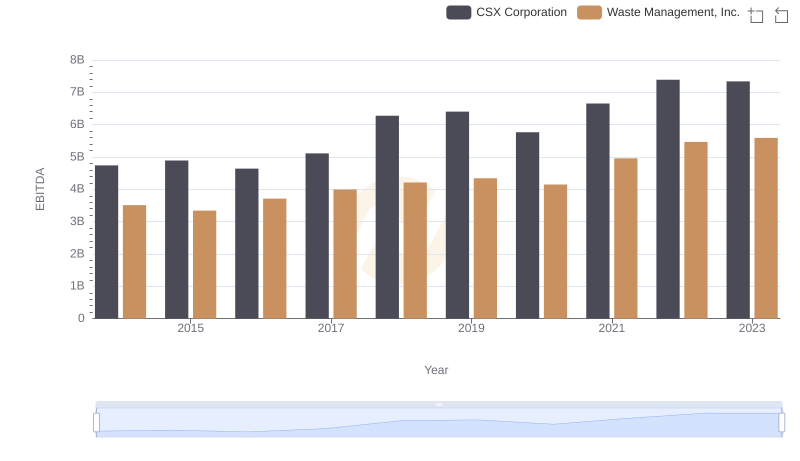
A Professional Review of EBITDA: Waste Management, Inc. Compared to CSX Corporation
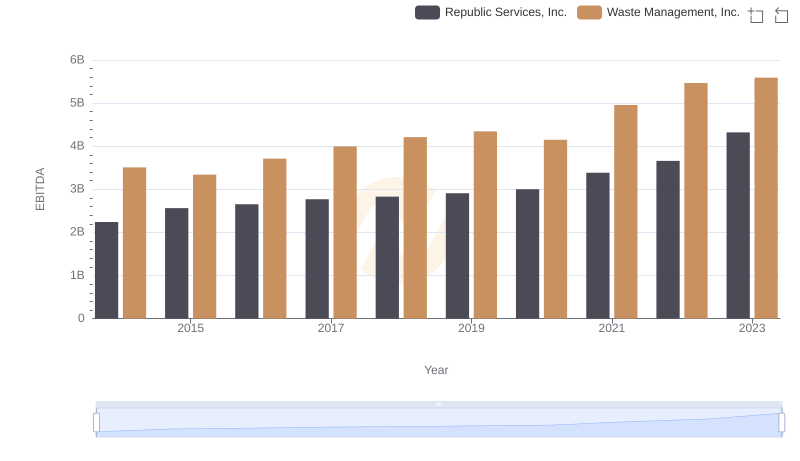
EBITDA Metrics Evaluated: Waste Management, Inc. vs Republic Services, Inc.
Waste Management, Inc. and Norfolk Southern Corporation: A Detailed Examination of EBITDA Performance