| __timestamp | CSX Corporation | Waste Management, Inc. |
|---|---|---|
| Wednesday, January 1, 2014 | 12669000000 | 13996000000 |
| Thursday, January 1, 2015 | 11811000000 | 12961000000 |
| Friday, January 1, 2016 | 11069000000 | 13609000000 |
| Sunday, January 1, 2017 | 11408000000 | 14485000000 |
| Monday, January 1, 2018 | 12250000000 | 14914000000 |
| Tuesday, January 1, 2019 | 11937000000 | 15455000000 |
| Wednesday, January 1, 2020 | 10583000000 | 15218000000 |
| Friday, January 1, 2021 | 12522000000 | 17931000000 |
| Saturday, January 1, 2022 | 14853000000 | 19698000000 |
| Sunday, January 1, 2023 | 14657000000 | 20426000000 |
| Monday, January 1, 2024 | 22063000000 |
Data in motion
In the ever-evolving landscape of American industry, Waste Management, Inc. and CSX Corporation stand as titans in their respective fields. Over the past decade, these companies have showcased remarkable resilience and growth. From 2014 to 2023, Waste Management, Inc. has seen its annual revenue soar by approximately 46%, reaching a peak of over $20 billion in 2023. Meanwhile, CSX Corporation, a leader in rail transportation, experienced a more modest growth of around 16% during the same period, with revenues peaking at nearly $15 billion in 2022.
This comparison highlights the dynamic nature of these industries, with Waste Management benefiting from increased environmental awareness and regulatory changes, while CSX navigates the challenges of fluctuating demand in freight transportation. As we look to the future, these trends offer valuable insights into the strategic directions these companies might take.
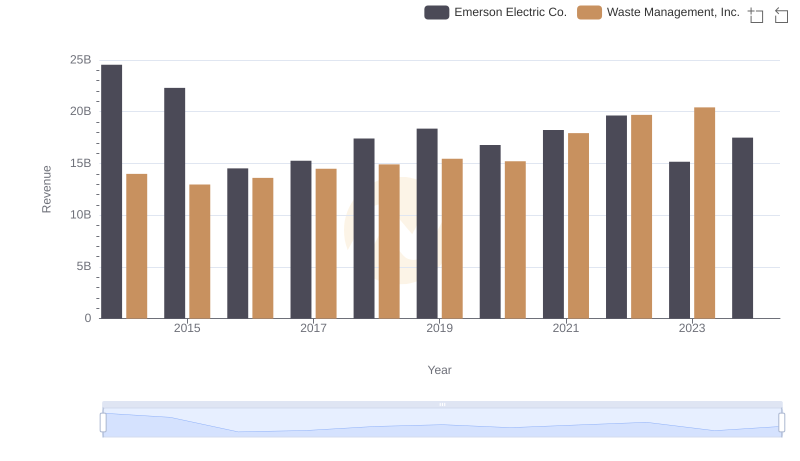
Waste Management, Inc. vs Emerson Electric Co.: Annual Revenue Growth Compared
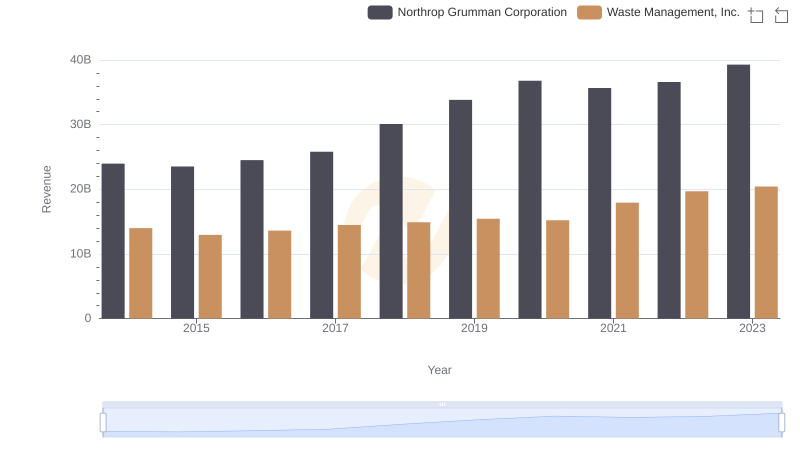
Waste Management, Inc. vs Northrop Grumman Corporation: Annual Revenue Growth Compared
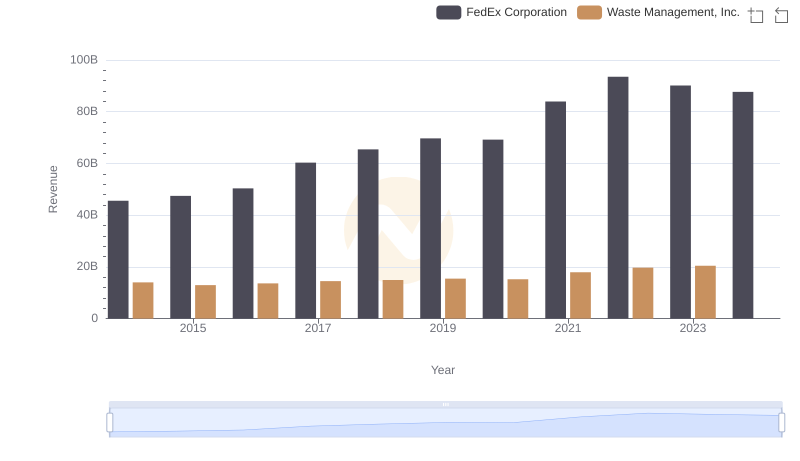
Waste Management, Inc. or FedEx Corporation: Who Leads in Yearly Revenue?
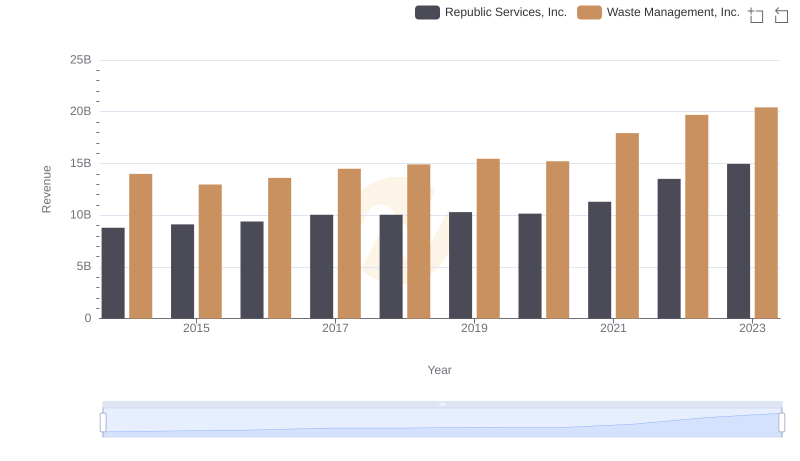
Waste Management, Inc. vs Republic Services, Inc.: Examining Key Revenue Metrics
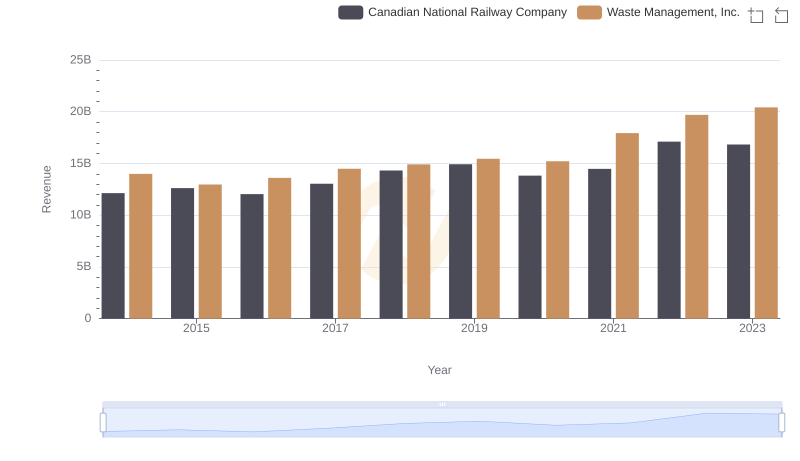
Waste Management, Inc. or Canadian National Railway Company: Who Leads in Yearly Revenue?

Revenue Showdown: Waste Management, Inc. vs Roper Technologies, Inc.
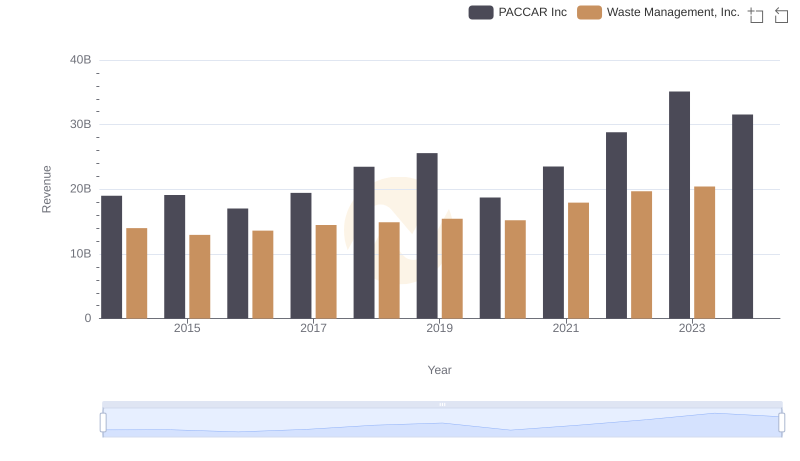
Waste Management, Inc. vs PACCAR Inc: Examining Key Revenue Metrics
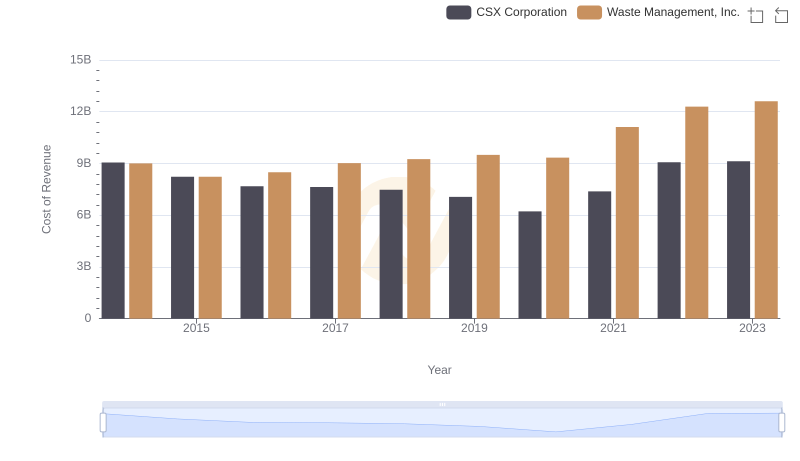
Cost of Revenue Comparison: Waste Management, Inc. vs CSX Corporation
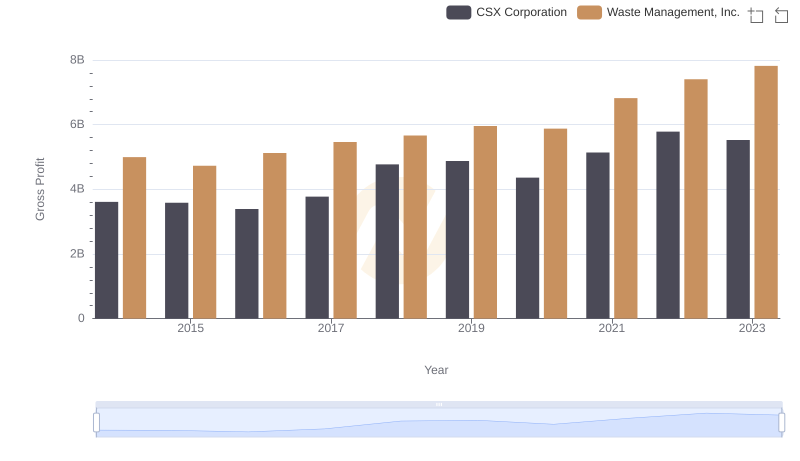
Waste Management, Inc. vs CSX Corporation: A Gross Profit Performance Breakdown
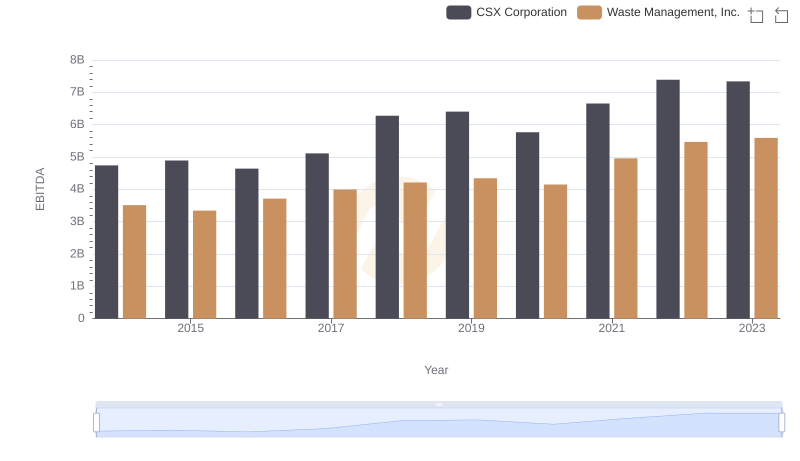
A Professional Review of EBITDA: Waste Management, Inc. Compared to CSX Corporation