| __timestamp | Emerson Electric Co. | Waste Management, Inc. |
|---|---|---|
| Wednesday, January 1, 2014 | 4397000000 | 3509000000 |
| Thursday, January 1, 2015 | 4578000000 | 3342000000 |
| Friday, January 1, 2016 | 3099000000 | 3713000000 |
| Sunday, January 1, 2017 | 3172000000 | 3996000000 |
| Monday, January 1, 2018 | 3627000000 | 4212000000 |
| Tuesday, January 1, 2019 | 3882000000 | 4344000000 |
| Wednesday, January 1, 2020 | 3364000000 | 4149000000 |
| Friday, January 1, 2021 | 4047000000 | 4956000000 |
| Saturday, January 1, 2022 | 3502000000 | 5466000000 |
| Sunday, January 1, 2023 | 4038000000 | 5592000000 |
| Monday, January 1, 2024 | 4032000000 | 5128000000 |
Cracking the code
In the ever-evolving landscape of corporate finance, EBITDA serves as a crucial metric for evaluating a company's operational performance. Waste Management, Inc. and Emerson Electric Co. have been industry stalwarts, each with its unique trajectory over the past decade. From 2014 to 2023, Waste Management's EBITDA grew by approximately 59%, peaking in 2023, while Emerson Electric experienced a more modest 8% increase over the same period. Notably, Waste Management's EBITDA surpassed Emerson's in 2017 and continued to lead, highlighting its robust growth strategy. However, data for Waste Management in 2024 is missing, leaving room for speculation on its future performance. This side-by-side analysis offers a compelling glimpse into how these giants have navigated economic shifts, providing valuable insights for investors and industry analysts alike.
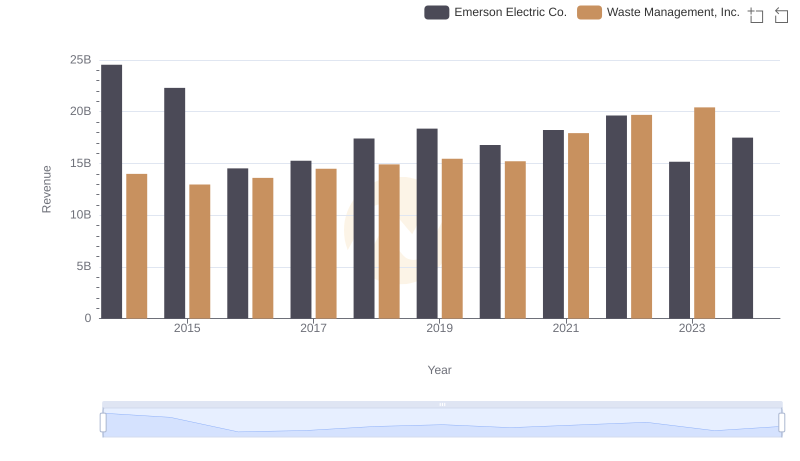
Waste Management, Inc. vs Emerson Electric Co.: Annual Revenue Growth Compared
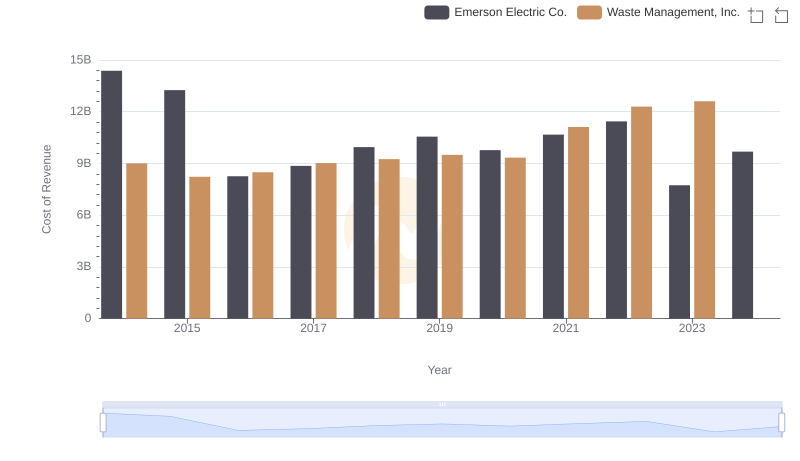
Cost of Revenue Trends: Waste Management, Inc. vs Emerson Electric Co.
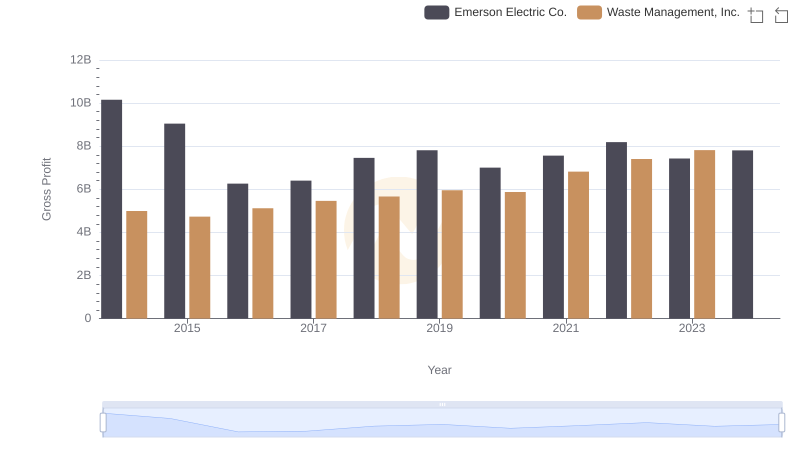
Who Generates Higher Gross Profit? Waste Management, Inc. or Emerson Electric Co.
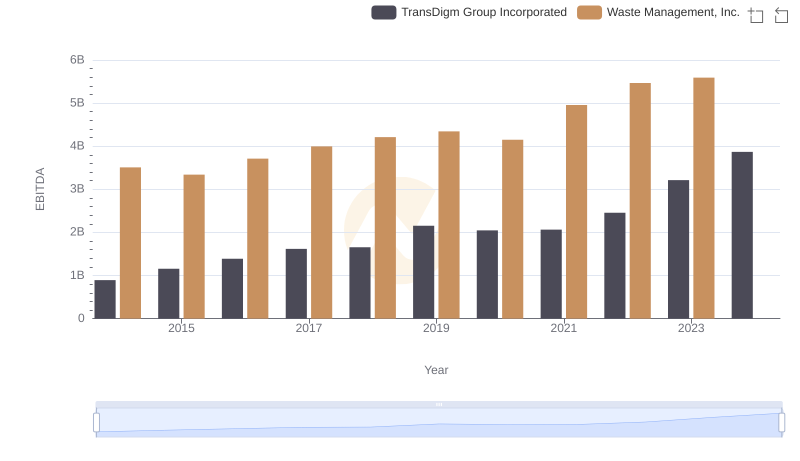
Waste Management, Inc. vs TransDigm Group Incorporated: In-Depth EBITDA Performance Comparison
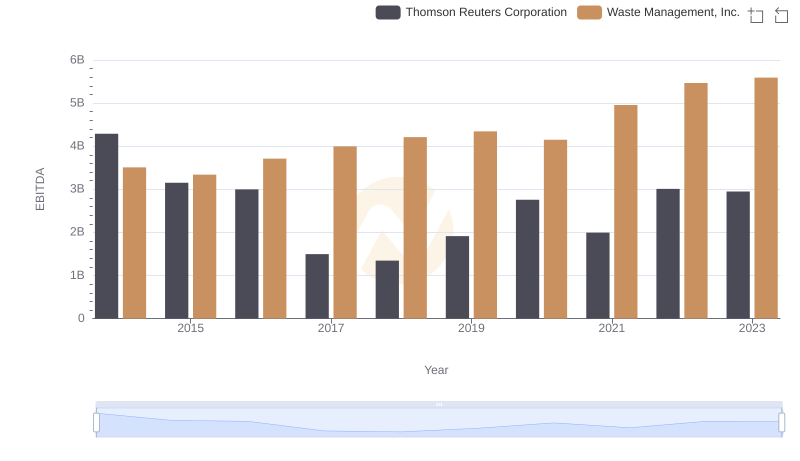
EBITDA Performance Review: Waste Management, Inc. vs Thomson Reuters Corporation

Professional EBITDA Benchmarking: Waste Management, Inc. vs FedEx Corporation
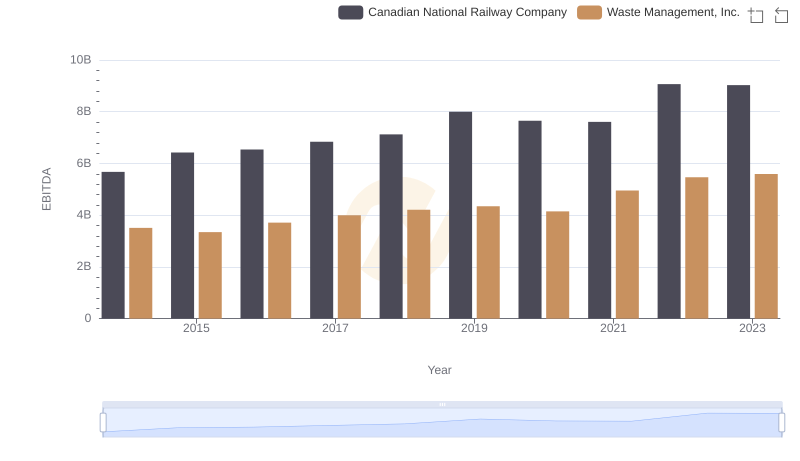
Comparative EBITDA Analysis: Waste Management, Inc. vs Canadian National Railway Company
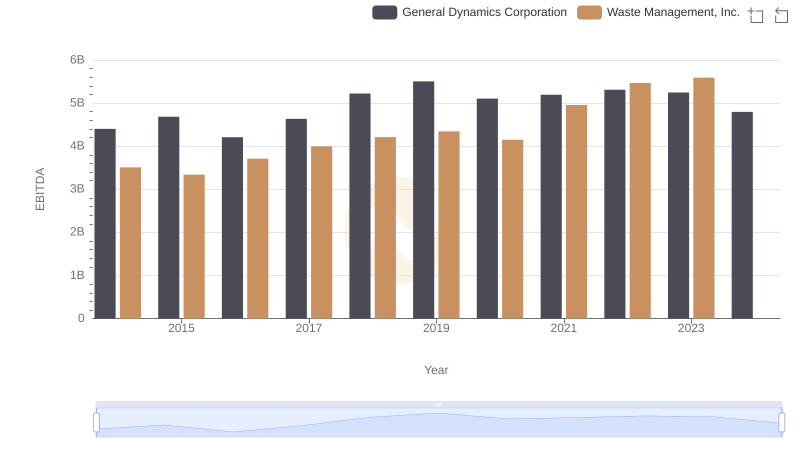
Comprehensive EBITDA Comparison: Waste Management, Inc. vs General Dynamics Corporation
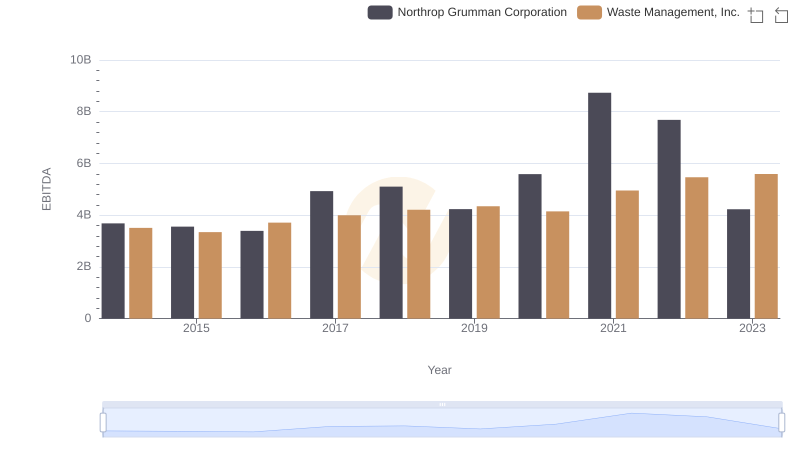
Waste Management, Inc. and Northrop Grumman Corporation: A Detailed Examination of EBITDA Performance