| __timestamp | Hubbell Incorporated | Rockwell Automation, Inc. |
|---|---|---|
| Wednesday, January 1, 2014 | 3359400000 | 6623500000 |
| Thursday, January 1, 2015 | 3390400000 | 6307900000 |
| Friday, January 1, 2016 | 3505200000 | 5879500000 |
| Sunday, January 1, 2017 | 3668800000 | 6311300000 |
| Monday, January 1, 2018 | 4481700000 | 6666000000 |
| Tuesday, January 1, 2019 | 4591000000 | 6694800000 |
| Wednesday, January 1, 2020 | 4186000000 | 6329800000 |
| Friday, January 1, 2021 | 4194100000 | 6997400000 |
| Saturday, January 1, 2022 | 4947900000 | 7760400000 |
| Sunday, January 1, 2023 | 5372900000 | 9058000000 |
| Monday, January 1, 2024 | 5628500000 | 8264200000 |
Unleashing the power of data
In the competitive landscape of industrial automation and electrical products, Rockwell Automation, Inc. and Hubbell Incorporated have been key players. Over the past decade, Rockwell Automation has consistently outperformed Hubbell in terms of revenue, with a notable 36% higher revenue in 2023. Starting in 2014, Rockwell's revenue was nearly double that of Hubbell's, and despite fluctuations, it maintained a strong lead. By 2023, Rockwell's revenue surged to approximately $9.06 billion, marking a significant growth from its 2014 figure. Meanwhile, Hubbell's revenue also showed a steady increase, reaching around $5.37 billion in 2023, reflecting a robust 60% growth over the decade. This data highlights the dynamic nature of the industry and the strategic maneuvers by these companies to capture market share. However, the absence of data for Hubbell in 2024 leaves room for speculation on its future trajectory.
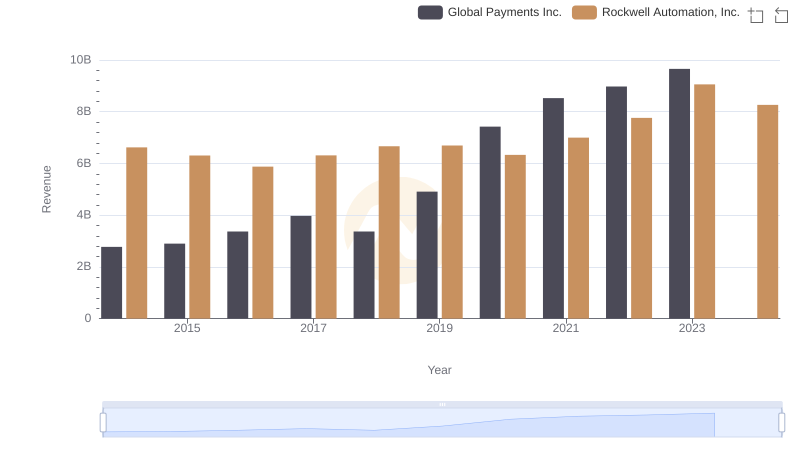
Comparing Revenue Performance: Rockwell Automation, Inc. or Global Payments Inc.?
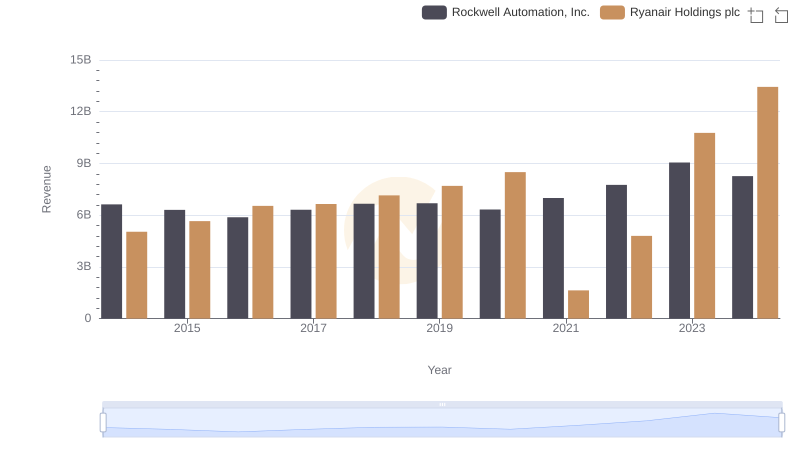
Rockwell Automation, Inc. and Ryanair Holdings plc: A Comprehensive Revenue Analysis
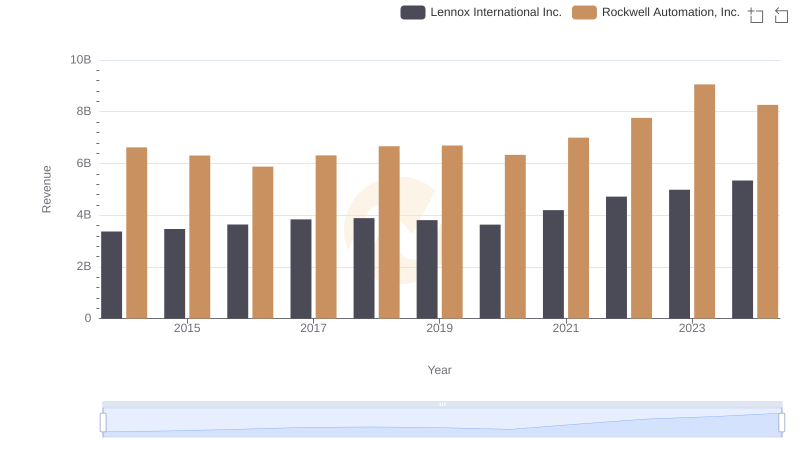
Revenue Insights: Rockwell Automation, Inc. and Lennox International Inc. Performance Compared
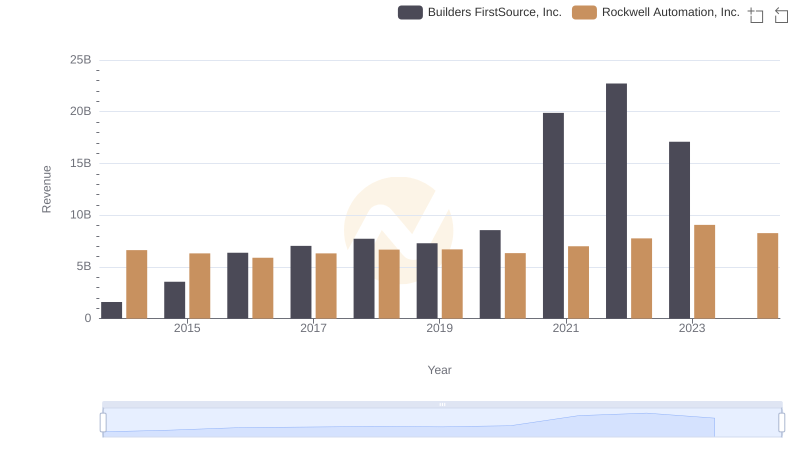
Revenue Insights: Rockwell Automation, Inc. and Builders FirstSource, Inc. Performance Compared
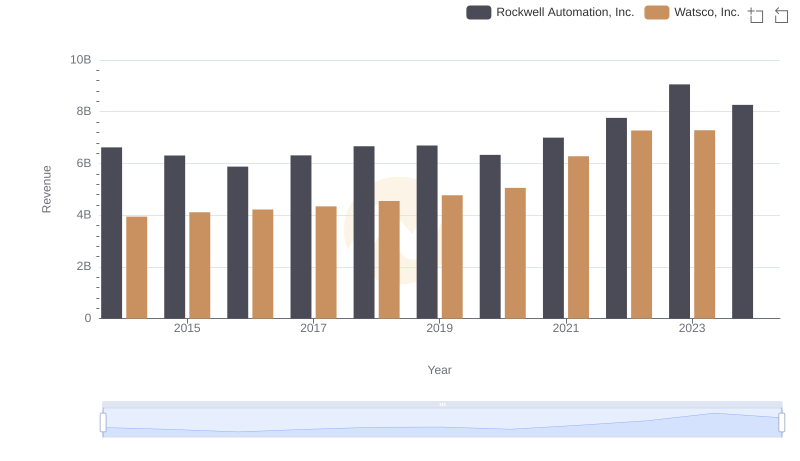
Annual Revenue Comparison: Rockwell Automation, Inc. vs Watsco, Inc.

Key Insights on Gross Profit: Rockwell Automation, Inc. vs Hubbell Incorporated
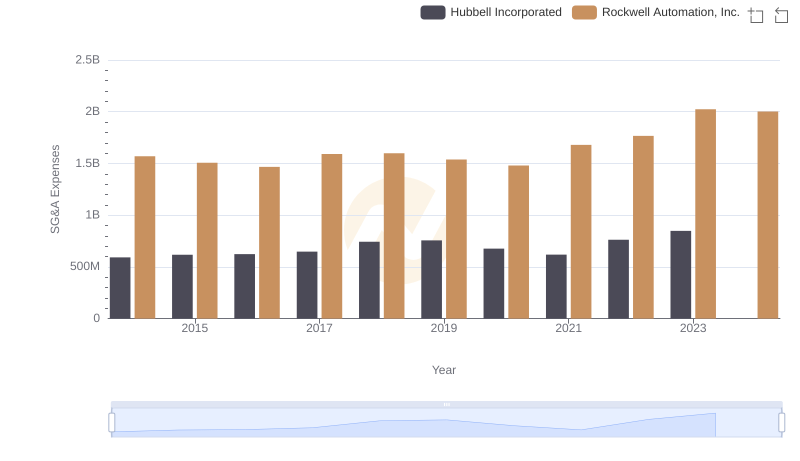
Operational Costs Compared: SG&A Analysis of Rockwell Automation, Inc. and Hubbell Incorporated
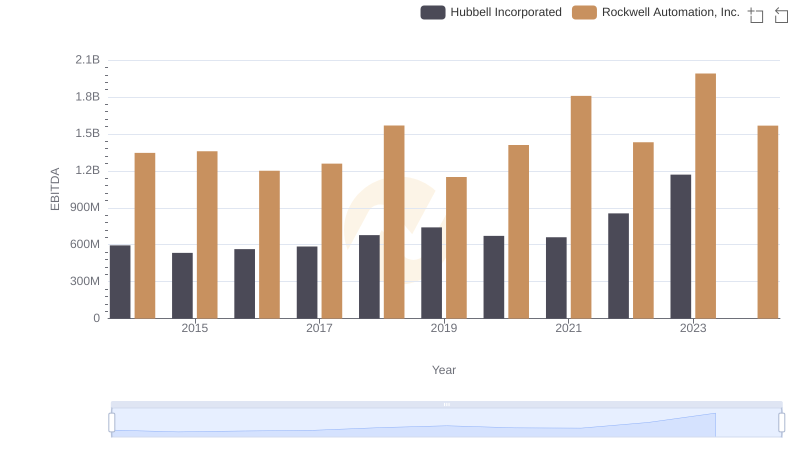
A Professional Review of EBITDA: Rockwell Automation, Inc. Compared to Hubbell Incorporated