| __timestamp | Hubbell Incorporated | Rockwell Automation, Inc. |
|---|---|---|
| Wednesday, January 1, 2014 | 1109000000 | 2753900000 |
| Thursday, January 1, 2015 | 1091800000 | 2703100000 |
| Friday, January 1, 2016 | 1100700000 | 2475500000 |
| Sunday, January 1, 2017 | 1151900000 | 2624200000 |
| Monday, January 1, 2018 | 1300400000 | 2872200000 |
| Tuesday, January 1, 2019 | 1352700000 | 2900100000 |
| Wednesday, January 1, 2020 | 1209300000 | 2595200000 |
| Friday, January 1, 2021 | 1151500000 | 2897700000 |
| Saturday, January 1, 2022 | 1471600000 | 3102000000 |
| Sunday, January 1, 2023 | 1888100000 | 3717000000 |
| Monday, January 1, 2024 | 1904100000 | 3193400000 |
Unlocking the unknown
In the competitive landscape of industrial automation and electrical products, Rockwell Automation and Hubbell Incorporated have showcased intriguing financial trajectories over the past decade. From 2014 to 2023, Rockwell Automation consistently outperformed Hubbell in gross profit, with a notable peak in 2023, reaching approximately 3.7 billion USD. This represents a robust 35% increase from its 2014 figures. Meanwhile, Hubbell's gross profit saw a significant rise of about 70% over the same period, culminating in 1.9 billion USD in 2023.
Despite Rockwell's higher absolute figures, Hubbell's growth rate is impressive, indicating a strong upward trend. The data for 2024 is incomplete, but the trends suggest continued growth for both companies. This analysis provides valuable insights for investors and industry analysts, highlighting the dynamic nature of the industrial sector and the potential for future growth.
Rockwell Automation leads in gross profit, but Hubbell shows faster growth.
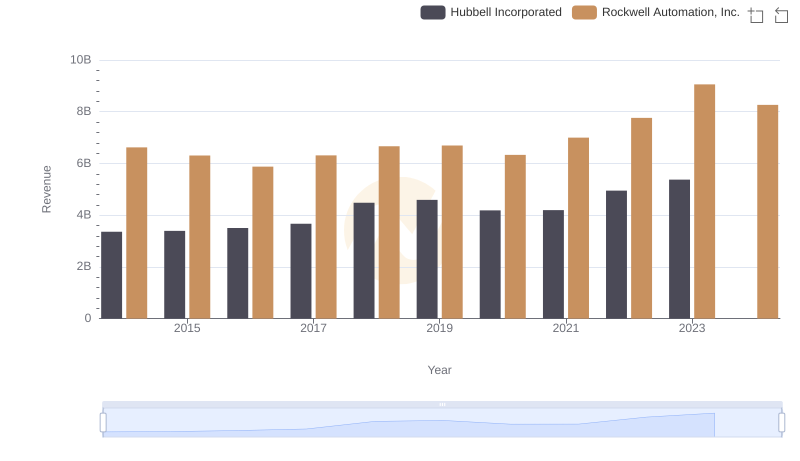
Revenue Showdown: Rockwell Automation, Inc. vs Hubbell Incorporated
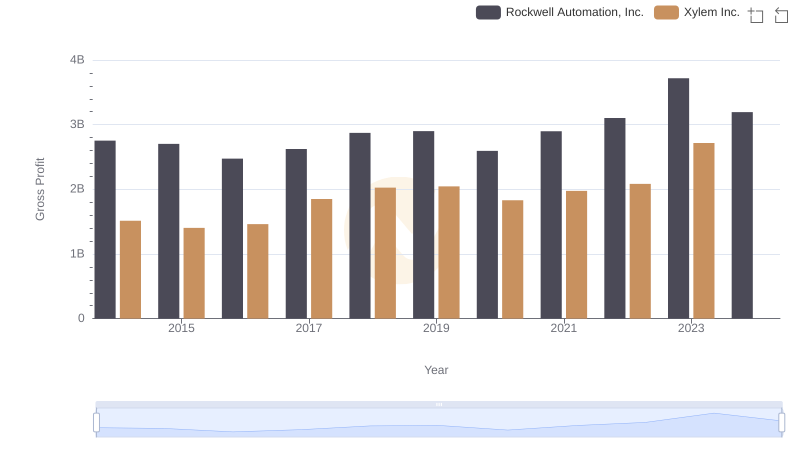
Gross Profit Comparison: Rockwell Automation, Inc. and Xylem Inc. Trends
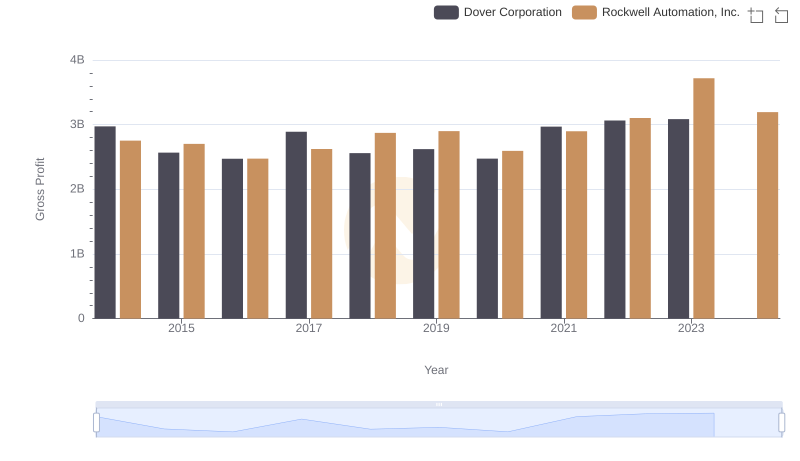
Gross Profit Analysis: Comparing Rockwell Automation, Inc. and Dover Corporation
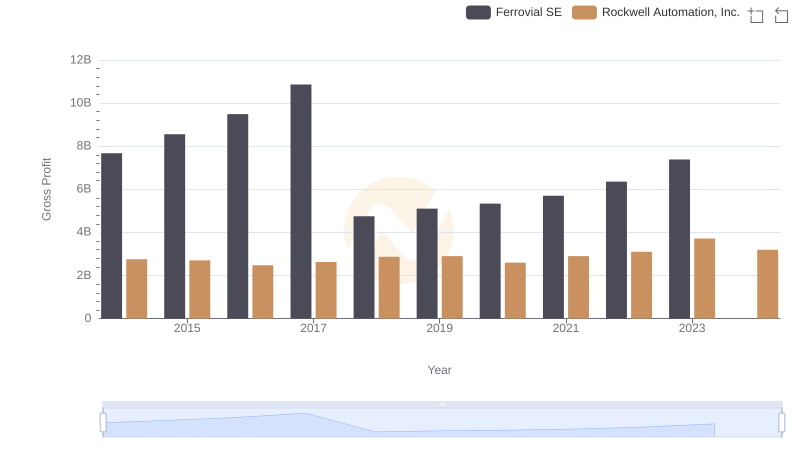
Key Insights on Gross Profit: Rockwell Automation, Inc. vs Ferrovial SE
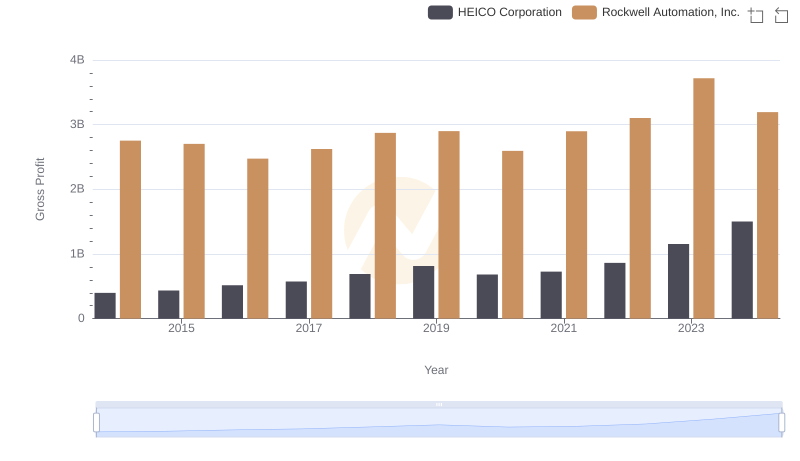
Gross Profit Analysis: Comparing Rockwell Automation, Inc. and HEICO Corporation
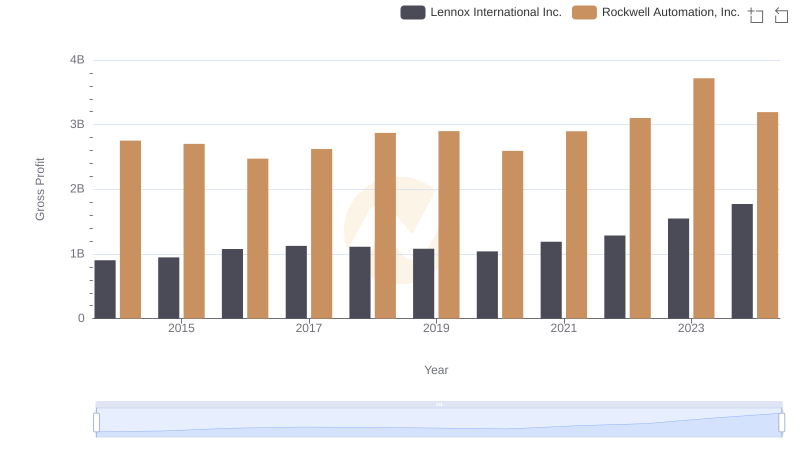
Rockwell Automation, Inc. vs Lennox International Inc.: A Gross Profit Performance Breakdown
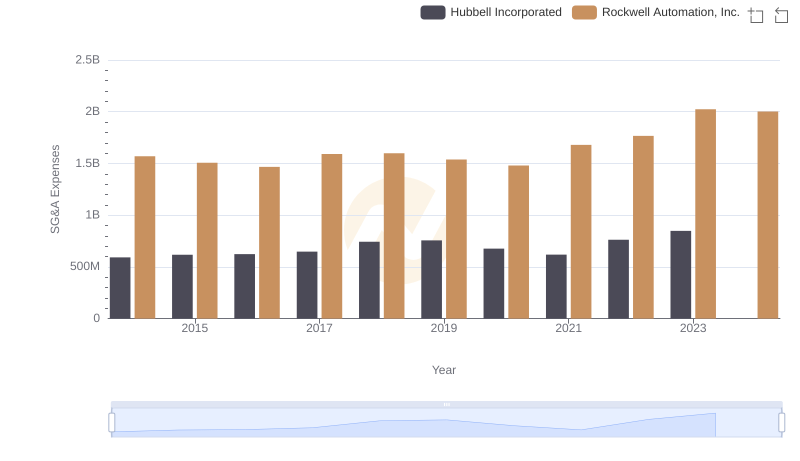
Operational Costs Compared: SG&A Analysis of Rockwell Automation, Inc. and Hubbell Incorporated
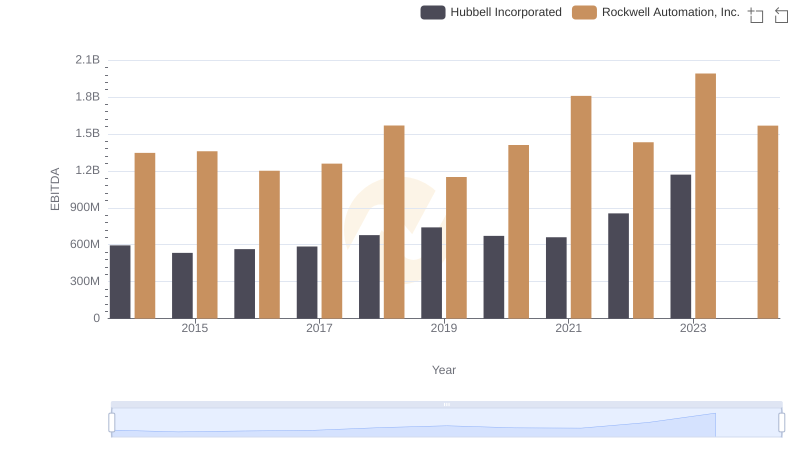
A Professional Review of EBITDA: Rockwell Automation, Inc. Compared to Hubbell Incorporated