| __timestamp | AMETEK, Inc. | XPO Logistics, Inc. |
|---|---|---|
| Wednesday, January 1, 2014 | 1023344000 | 56600000 |
| Thursday, January 1, 2015 | 1093776000 | 298000000 |
| Friday, January 1, 2016 | 1007213000 | 1108300000 |
| Sunday, January 1, 2017 | 1068174000 | 1196700000 |
| Monday, January 1, 2018 | 1269415000 | 1488000000 |
| Tuesday, January 1, 2019 | 1411422000 | 1594000000 |
| Wednesday, January 1, 2020 | 1283159000 | 727000000 |
| Friday, January 1, 2021 | 1600782000 | 741000000 |
| Saturday, January 1, 2022 | 1820119000 | 941000000 |
| Sunday, January 1, 2023 | 2025843000 | 860000000 |
| Monday, January 1, 2024 | 1779562000 | 1186000000 |
Unleashing insights
In the ever-evolving landscape of industrial and logistics sectors, AMETEK, Inc. and XPO Logistics, Inc. have emerged as formidable players. Over the past decade, these companies have demonstrated remarkable resilience and growth in their EBITDA performance.
From 2014 to 2023, AMETEK, Inc. has seen a steady climb in its EBITDA, with a notable increase of approximately 98% from its 2014 figures. This growth trajectory underscores AMETEK's strategic prowess in navigating market challenges and capitalizing on opportunities.
Conversely, XPO Logistics, Inc. experienced a dramatic surge in EBITDA, peaking in 2019 with a staggering 2,700% increase from 2014. However, the subsequent years saw fluctuations, reflecting the dynamic nature of the logistics industry.
This comparative analysis offers a window into the strategic maneuvers and market conditions that have shaped these industry titans over the years.
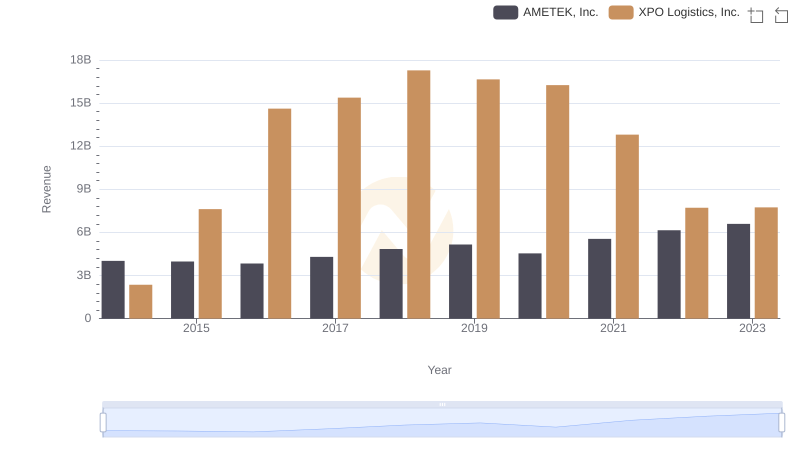
Who Generates More Revenue? AMETEK, Inc. or XPO Logistics, Inc.
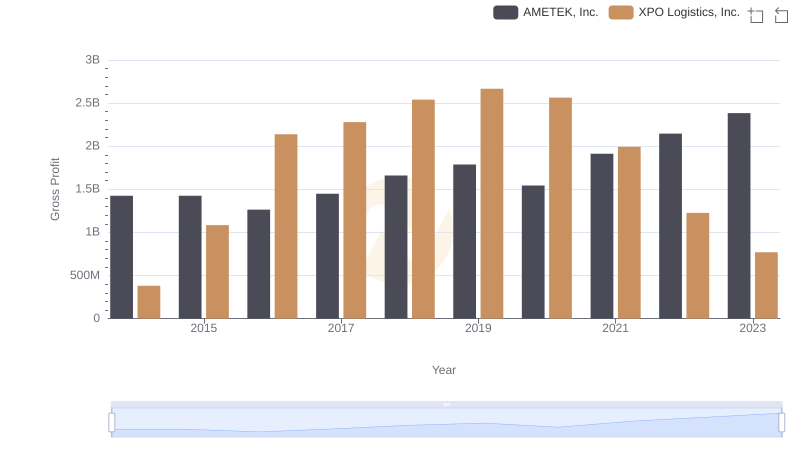
Gross Profit Comparison: AMETEK, Inc. and XPO Logistics, Inc. Trends
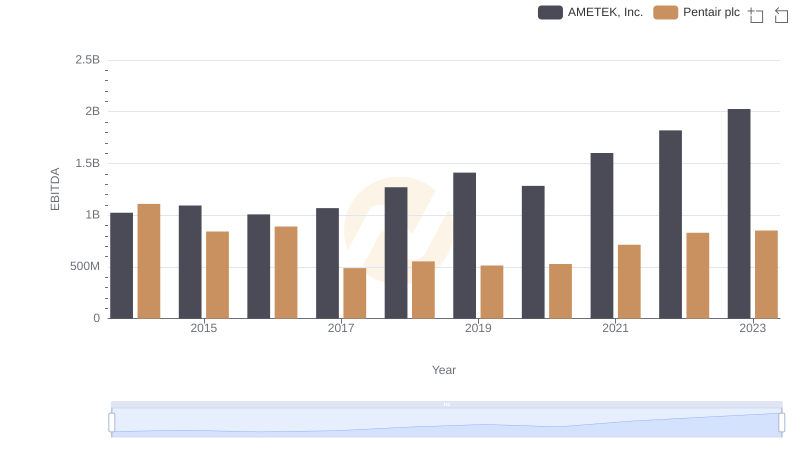
A Professional Review of EBITDA: AMETEK, Inc. Compared to Pentair plc
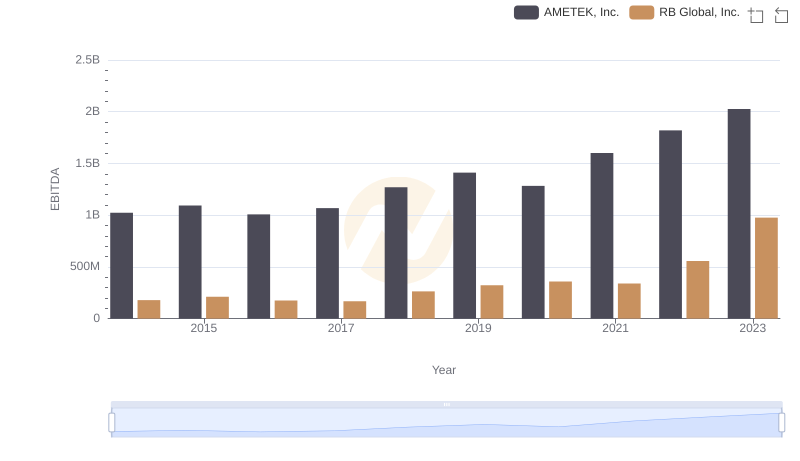
A Professional Review of EBITDA: AMETEK, Inc. Compared to RB Global, Inc.
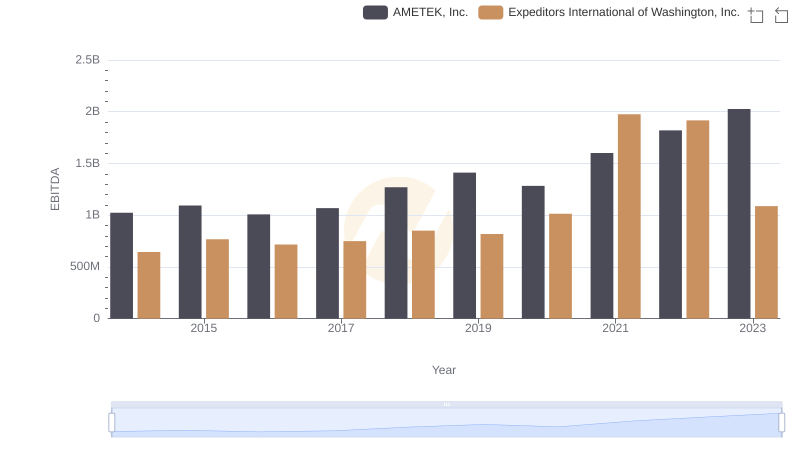
AMETEK, Inc. and Expeditors International of Washington, Inc.: A Detailed Examination of EBITDA Performance
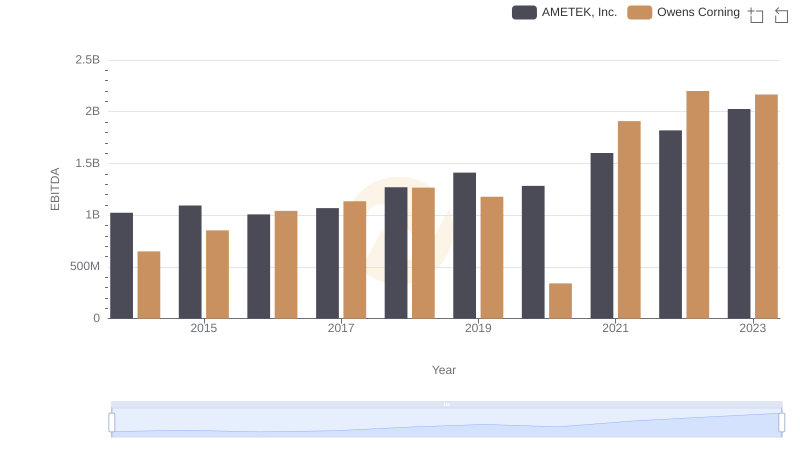
EBITDA Performance Review: AMETEK, Inc. vs Owens Corning
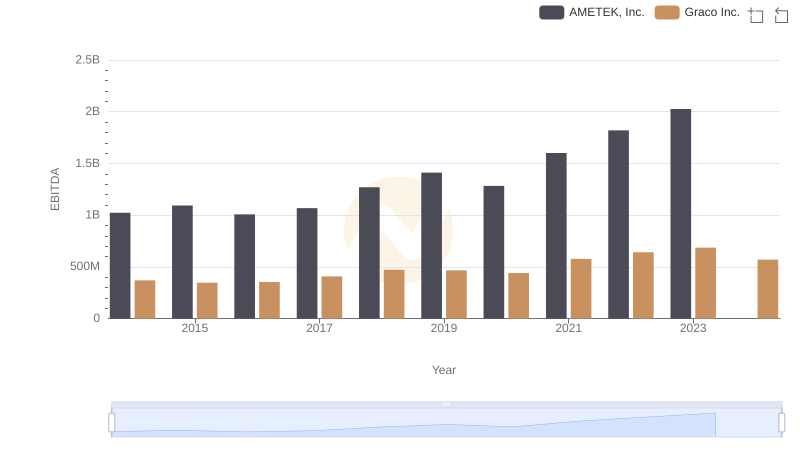
AMETEK, Inc. and Graco Inc.: A Detailed Examination of EBITDA Performance