| __timestamp | Allegion plc | Axon Enterprise, Inc. |
|---|---|---|
| Wednesday, January 1, 2014 | 853700000 | 101548000 |
| Thursday, January 1, 2015 | 869100000 | 128647000 |
| Friday, January 1, 2016 | 985300000 | 170536000 |
| Sunday, January 1, 2017 | 1070700000 | 207088000 |
| Monday, January 1, 2018 | 1173300000 | 258583000 |
| Tuesday, January 1, 2019 | 1252300000 | 307286000 |
| Wednesday, January 1, 2020 | 1178800000 | 416331000 |
| Friday, January 1, 2021 | 1204900000 | 540910000 |
| Saturday, January 1, 2022 | 1322400000 | 728638000 |
| Sunday, January 1, 2023 | 1581500000 | 955382000 |
| Monday, January 1, 2024 | 1668500000 |
Unlocking the unknown
In the ever-evolving landscape of the security and technology sectors, Axon Enterprise, Inc. and Allegion plc have emerged as key players. Over the past decade, these companies have shown remarkable growth in their gross profits, reflecting their strategic prowess and market adaptability. From 2014 to 2023, Allegion plc's gross profit surged by approximately 85%, reaching its peak in 2023. Meanwhile, Axon Enterprise, Inc. demonstrated an even more impressive trajectory, with its gross profit increasing nearly ninefold during the same period.
These trends underscore the dynamic nature of the industry and the companies' ability to capitalize on emerging opportunities.
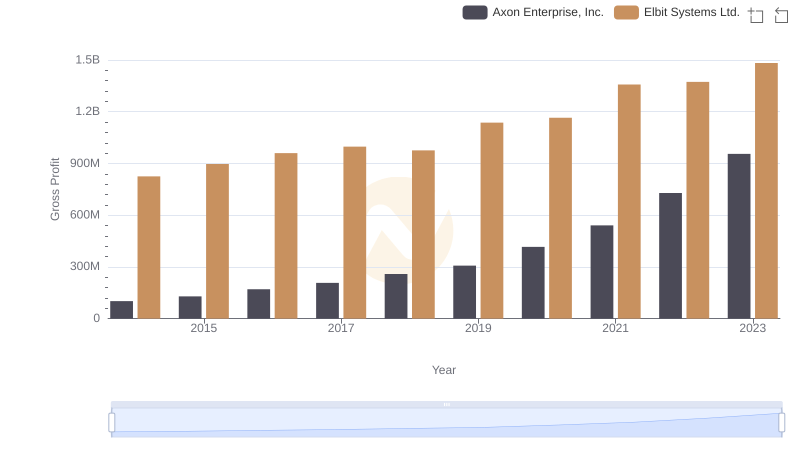
Gross Profit Analysis: Comparing Axon Enterprise, Inc. and Elbit Systems Ltd.
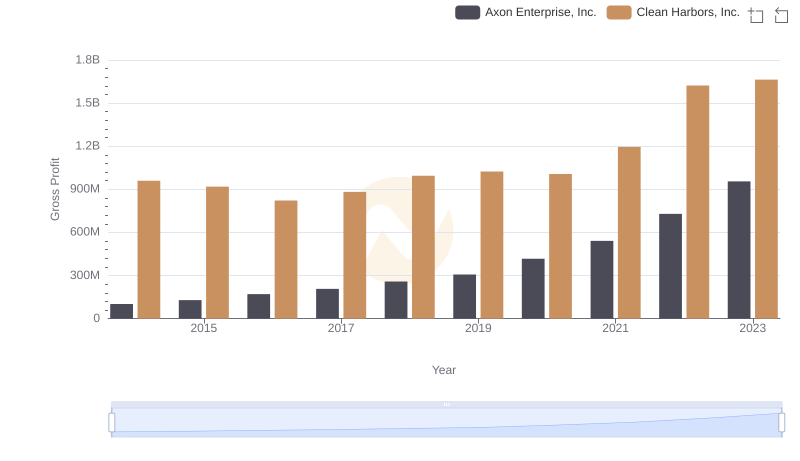
Key Insights on Gross Profit: Axon Enterprise, Inc. vs Clean Harbors, Inc.
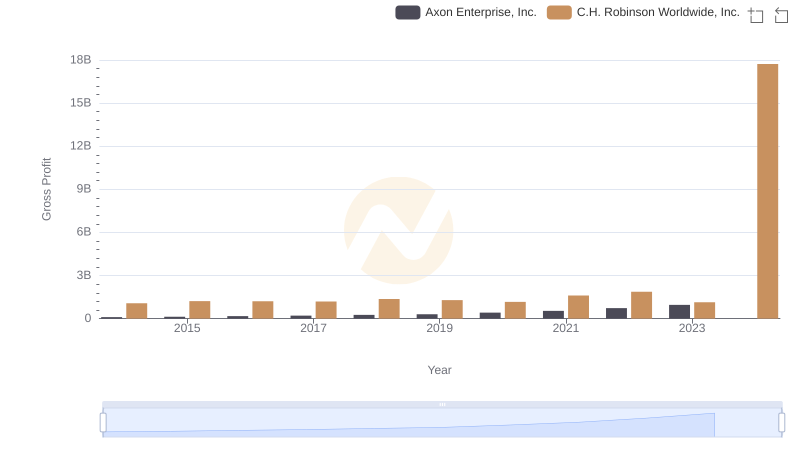
Gross Profit Trends Compared: Axon Enterprise, Inc. vs C.H. Robinson Worldwide, Inc.
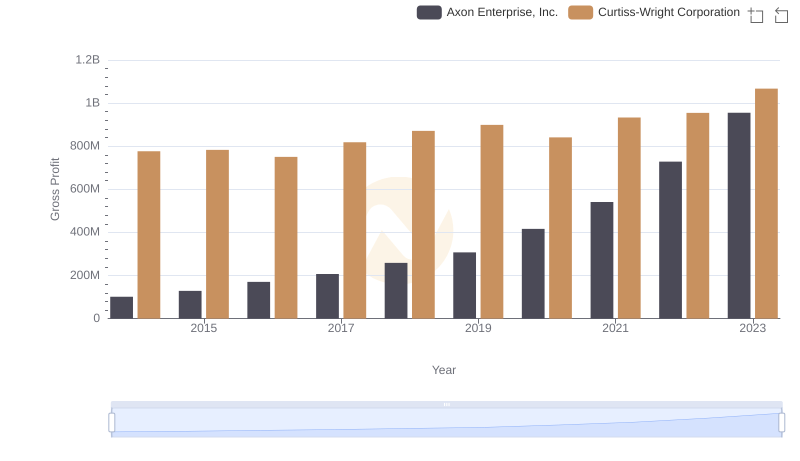
Gross Profit Trends Compared: Axon Enterprise, Inc. vs Curtiss-Wright Corporation
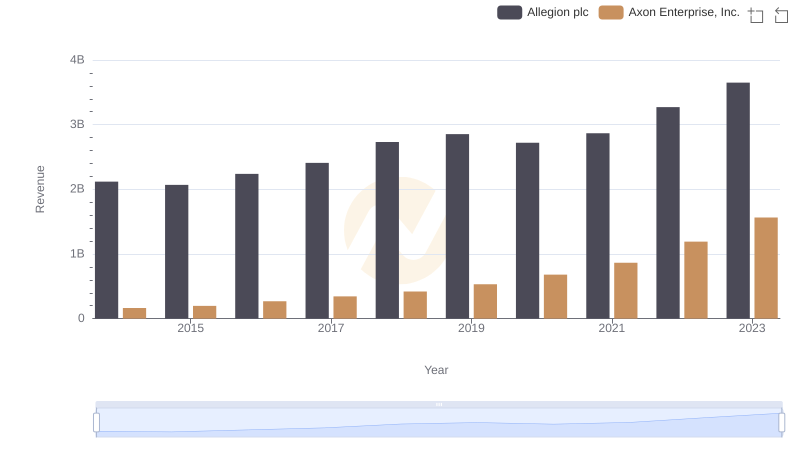
Axon Enterprise, Inc. vs Allegion plc: Annual Revenue Growth Compared
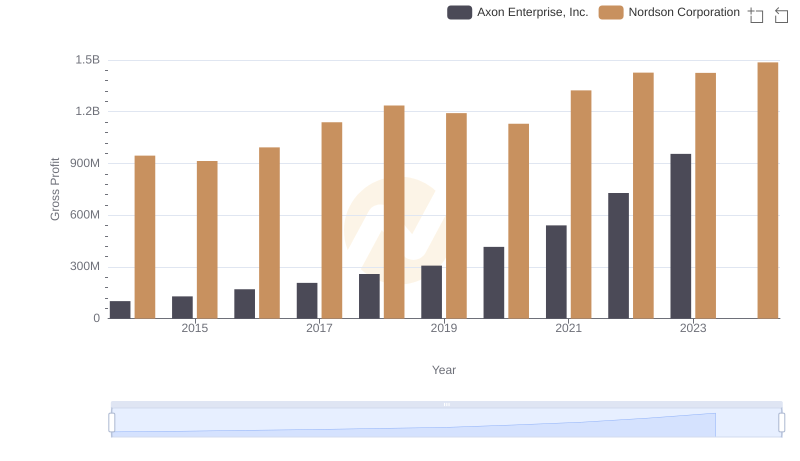
Axon Enterprise, Inc. vs Nordson Corporation: A Gross Profit Performance Breakdown
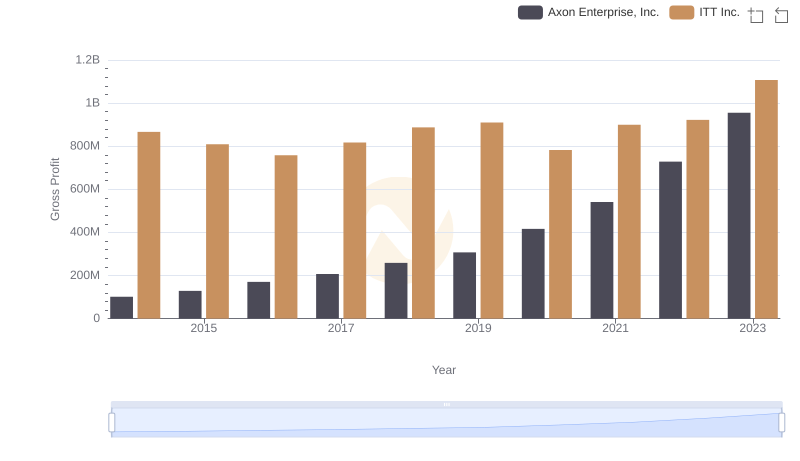
Gross Profit Analysis: Comparing Axon Enterprise, Inc. and ITT Inc.
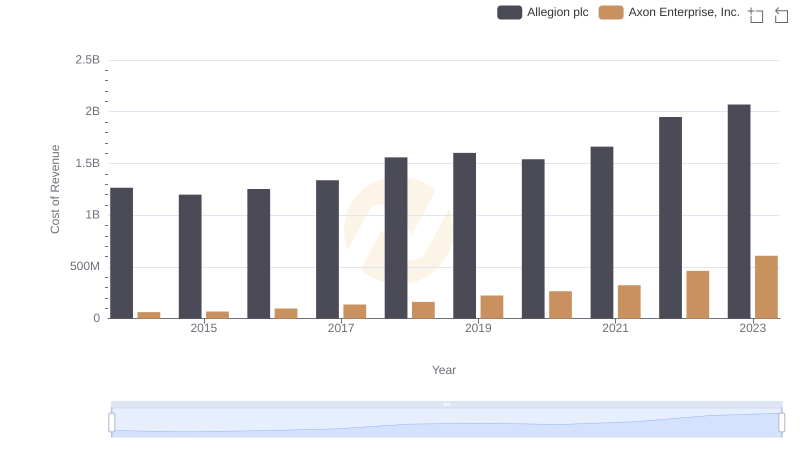
Axon Enterprise, Inc. vs Allegion plc: Efficiency in Cost of Revenue Explored
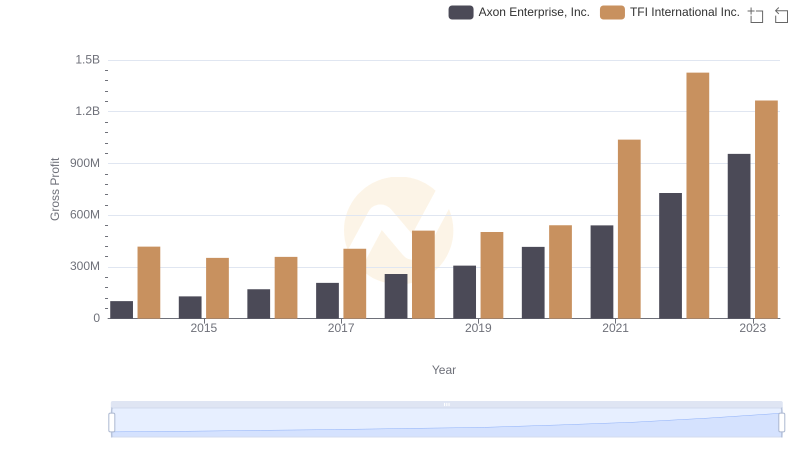
Key Insights on Gross Profit: Axon Enterprise, Inc. vs TFI International Inc.

Research and Development Investment: Axon Enterprise, Inc. vs Allegion plc
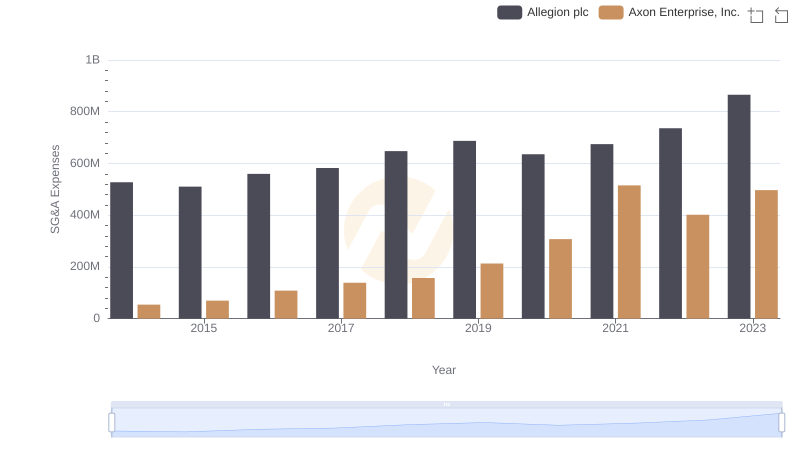
Who Optimizes SG&A Costs Better? Axon Enterprise, Inc. or Allegion plc