| __timestamp | Owens Corning | Rockwell Automation, Inc. |
|---|---|---|
| Wednesday, January 1, 2014 | 5276000000 | 6623500000 |
| Thursday, January 1, 2015 | 5350000000 | 6307900000 |
| Friday, January 1, 2016 | 5677000000 | 5879500000 |
| Sunday, January 1, 2017 | 6384000000 | 6311300000 |
| Monday, January 1, 2018 | 7057000000 | 6666000000 |
| Tuesday, January 1, 2019 | 7160000000 | 6694800000 |
| Wednesday, January 1, 2020 | 7055000000 | 6329800000 |
| Friday, January 1, 2021 | 8498000000 | 6997400000 |
| Saturday, January 1, 2022 | 9761000000 | 7760400000 |
| Sunday, January 1, 2023 | 9677000000 | 9058000000 |
| Monday, January 1, 2024 | 8264200000 |
Unleashing insights
In the competitive landscape of industrial giants, Rockwell Automation and Owens Corning have been vying for revenue supremacy over the past decade. From 2014 to 2023, Owens Corning has seen a remarkable 83% increase in revenue, peaking in 2022 with a 9.76 billion USD turnover. Meanwhile, Rockwell Automation has shown steady growth, culminating in a 9.06 billion USD revenue in 2023, marking a 37% rise since 2014.
Owens Corning's revenue trajectory has been impressive, particularly from 2020 to 2022, where it surged by 38%. Rockwell Automation, while slightly trailing, has consistently maintained a close margin, with its highest revenue recorded in 2023. The data for 2024 is incomplete, leaving room for speculation on future trends.
As these industrial titans continue to innovate, the revenue race remains a captivating spectacle for investors and industry watchers alike.
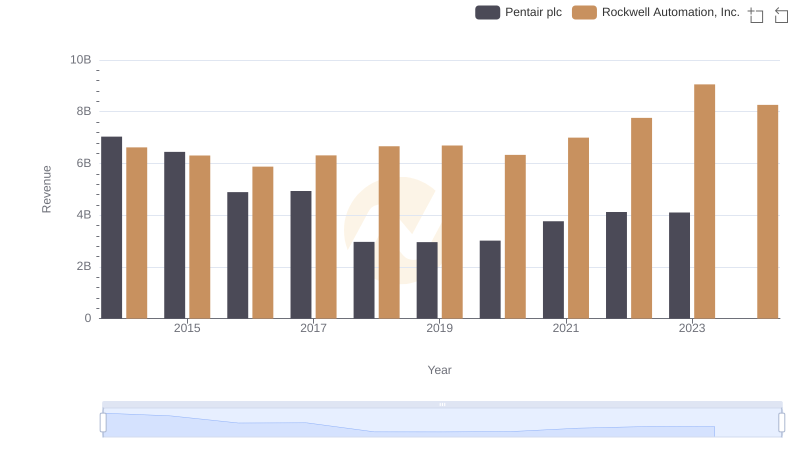
Revenue Insights: Rockwell Automation, Inc. and Pentair plc Performance Compared
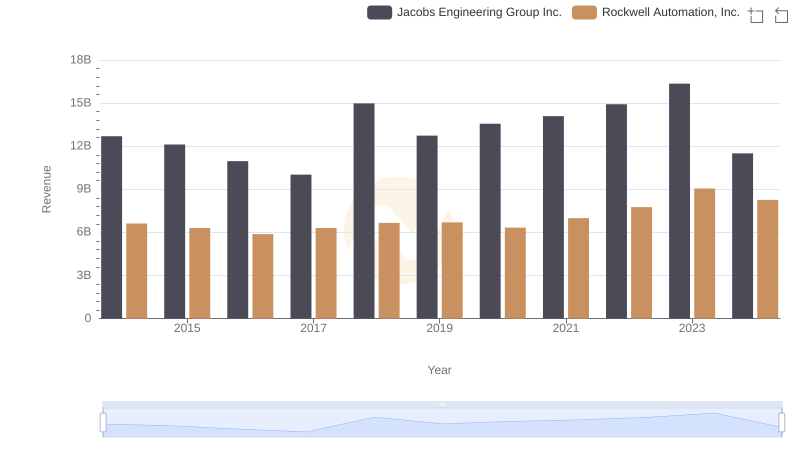
Rockwell Automation, Inc. vs Jacobs Engineering Group Inc.: Annual Revenue Growth Compared
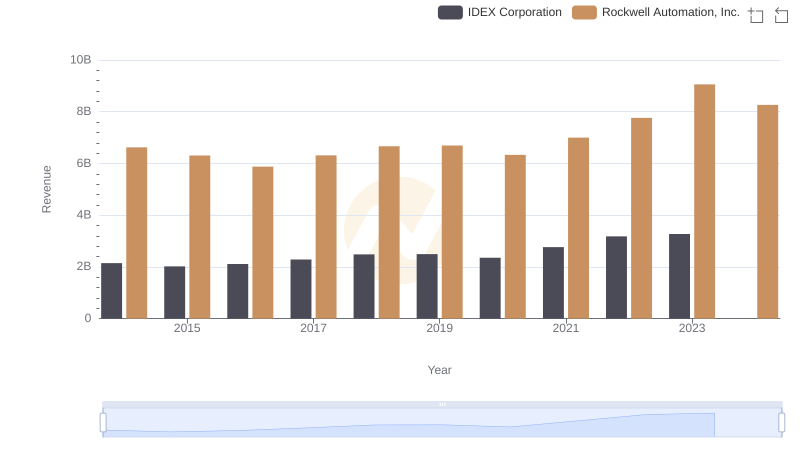
Comparing Revenue Performance: Rockwell Automation, Inc. or IDEX Corporation?
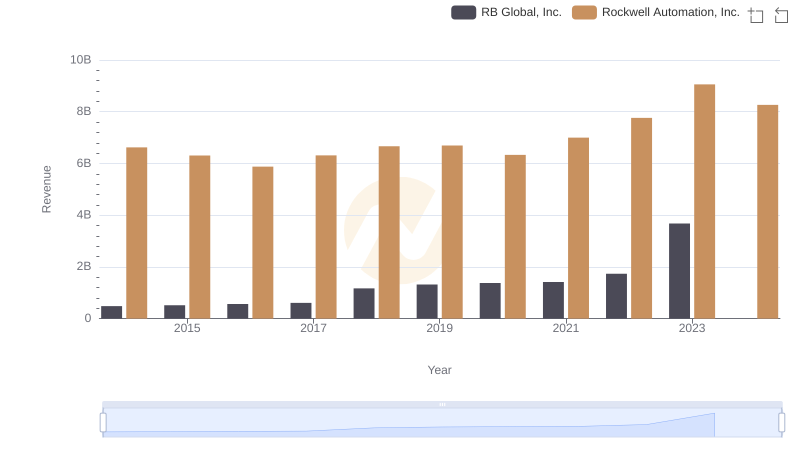
Rockwell Automation, Inc. and RB Global, Inc.: A Comprehensive Revenue Analysis
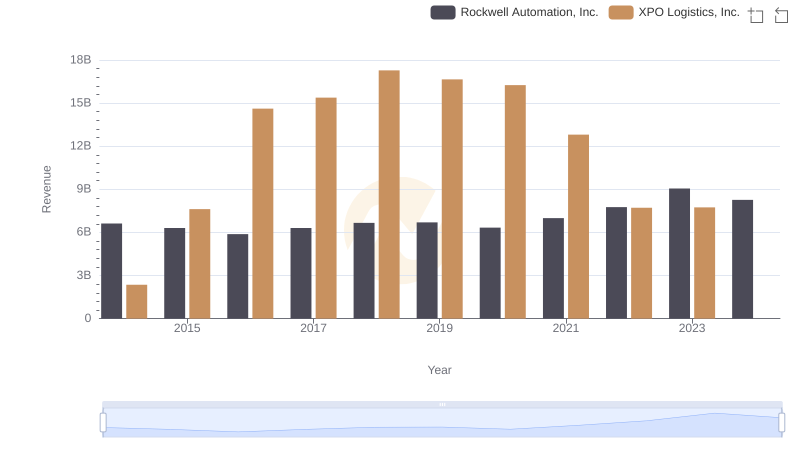
Revenue Showdown: Rockwell Automation, Inc. vs XPO Logistics, Inc.
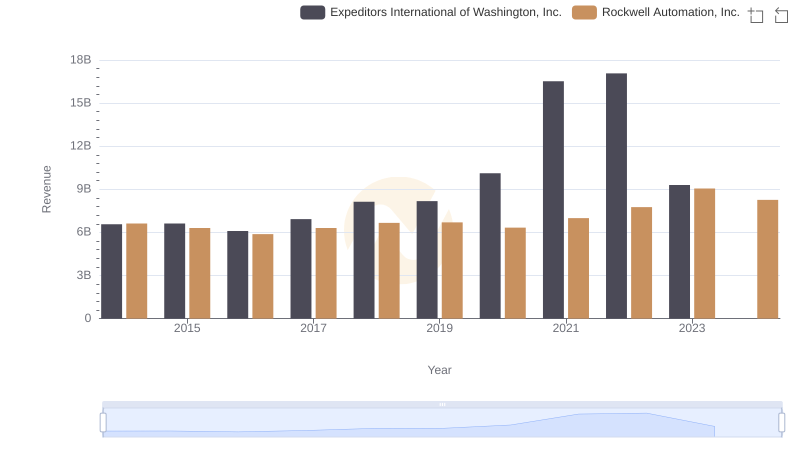
Comparing Revenue Performance: Rockwell Automation, Inc. or Expeditors International of Washington, Inc.?
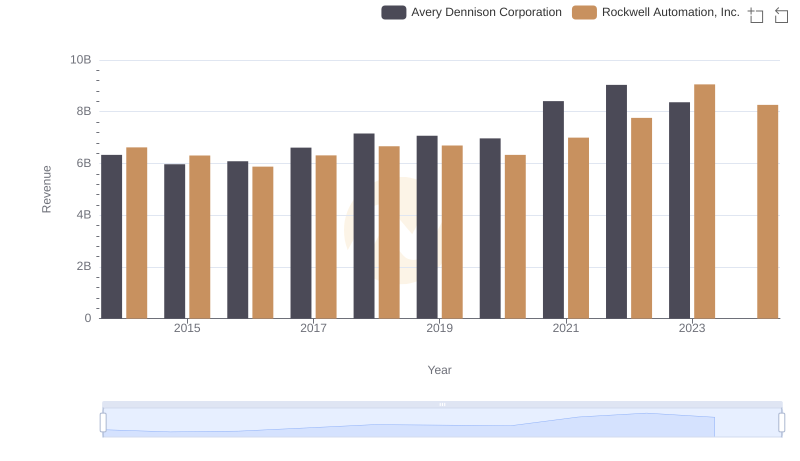
Rockwell Automation, Inc. or Avery Dennison Corporation: Who Leads in Yearly Revenue?
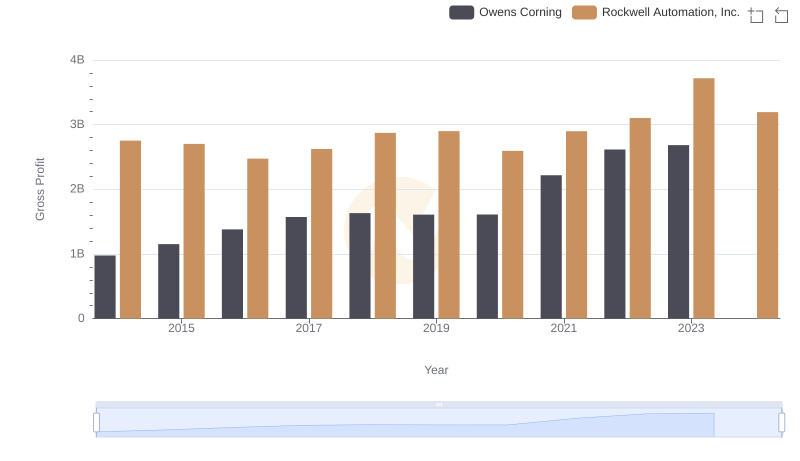
Gross Profit Trends Compared: Rockwell Automation, Inc. vs Owens Corning
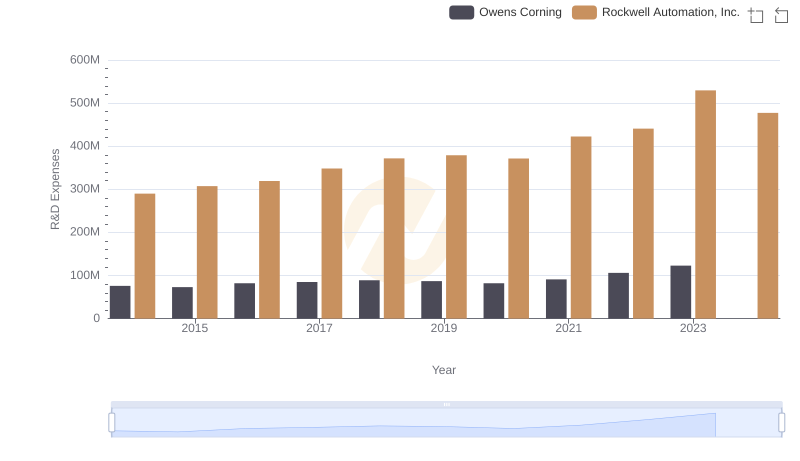
R&D Spending Showdown: Rockwell Automation, Inc. vs Owens Corning
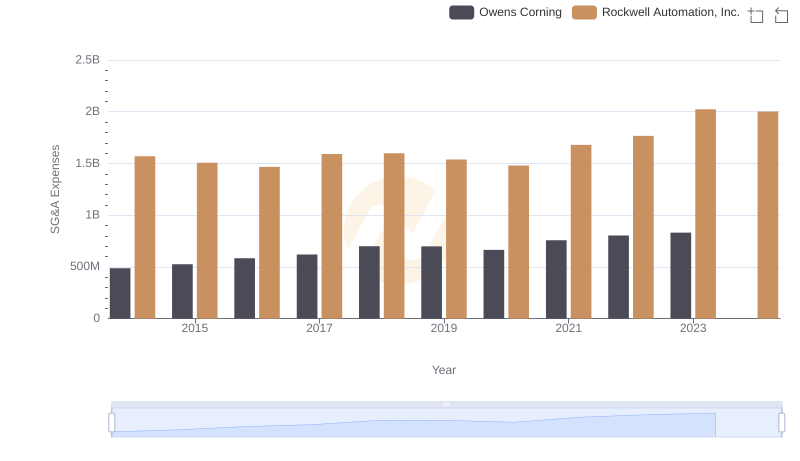
Operational Costs Compared: SG&A Analysis of Rockwell Automation, Inc. and Owens Corning
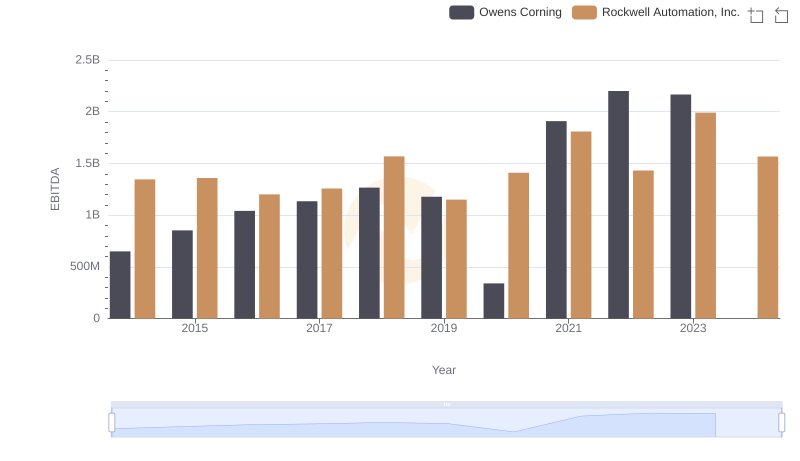
EBITDA Analysis: Evaluating Rockwell Automation, Inc. Against Owens Corning