| __timestamp | RB Global, Inc. | Rockwell Automation, Inc. |
|---|---|---|
| Wednesday, January 1, 2014 | 481097000 | 6623500000 |
| Thursday, January 1, 2015 | 515875000 | 6307900000 |
| Friday, January 1, 2016 | 566395000 | 5879500000 |
| Sunday, January 1, 2017 | 610517000 | 6311300000 |
| Monday, January 1, 2018 | 1170026000 | 6666000000 |
| Tuesday, January 1, 2019 | 1318641000 | 6694800000 |
| Wednesday, January 1, 2020 | 1377260000 | 6329800000 |
| Friday, January 1, 2021 | 1416971000 | 6997400000 |
| Saturday, January 1, 2022 | 1733808000 | 7760400000 |
| Sunday, January 1, 2023 | 3679600000 | 9058000000 |
| Monday, January 1, 2024 | 4284200000 | 8264200000 |
Unlocking the unknown
In the ever-evolving landscape of industrial automation and auction services, Rockwell Automation, Inc. and RB Global, Inc. stand as titans. Over the past decade, Rockwell Automation has consistently demonstrated robust growth, with its revenue peaking at approximately $9.1 billion in 2023, marking a 37% increase from 2014. Meanwhile, RB Global has shown remarkable resilience, with its revenue surging by over 660% from 2014 to 2023, reaching nearly $3.7 billion.
Rockwell Automation's revenue trajectory reflects steady growth, with a notable jump in 2022, while RB Global's revenue saw a dramatic rise in 2023. This data highlights the dynamic nature of these industries and the strategic maneuvers by these companies to capture market share. However, 2024 data for RB Global remains elusive, leaving room for speculation on its future performance.
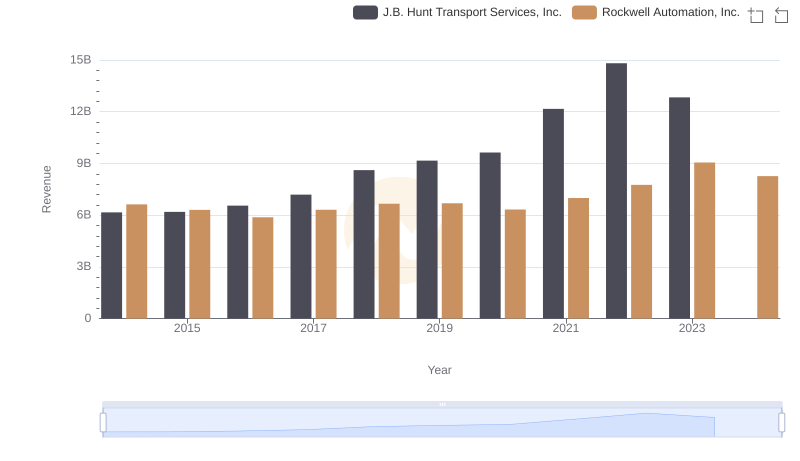
Rockwell Automation, Inc. vs J.B. Hunt Transport Services, Inc.: Annual Revenue Growth Compared
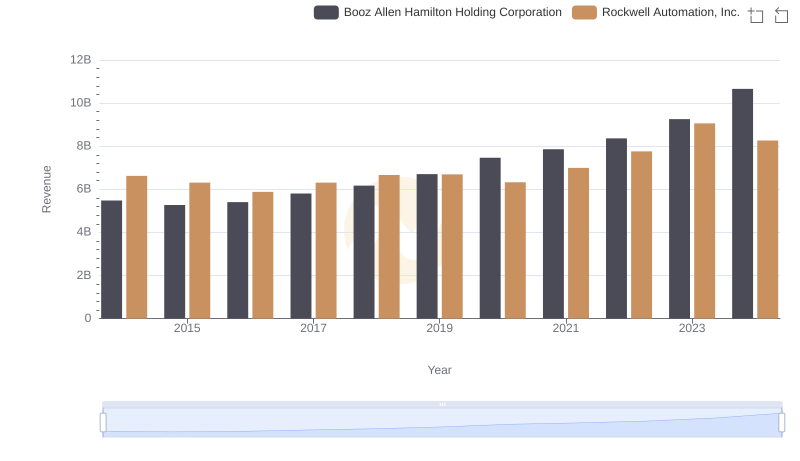
Breaking Down Revenue Trends: Rockwell Automation, Inc. vs Booz Allen Hamilton Holding Corporation
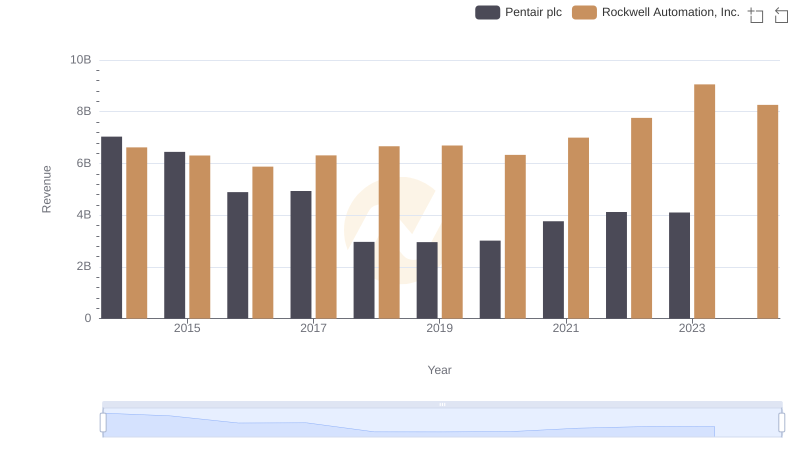
Revenue Insights: Rockwell Automation, Inc. and Pentair plc Performance Compared
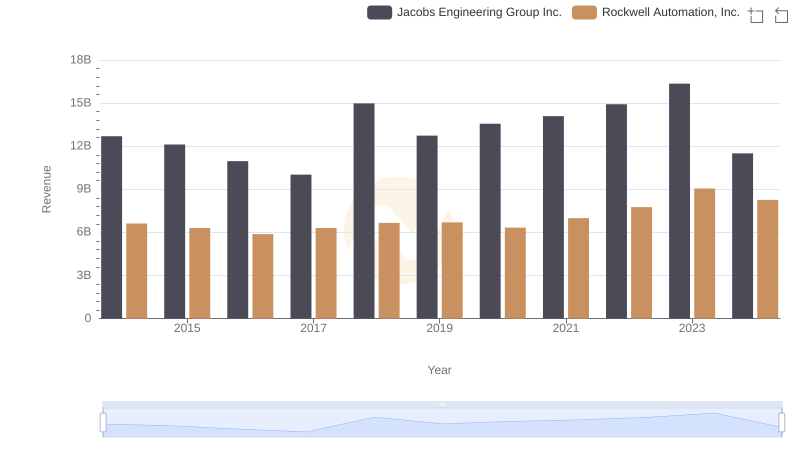
Rockwell Automation, Inc. vs Jacobs Engineering Group Inc.: Annual Revenue Growth Compared
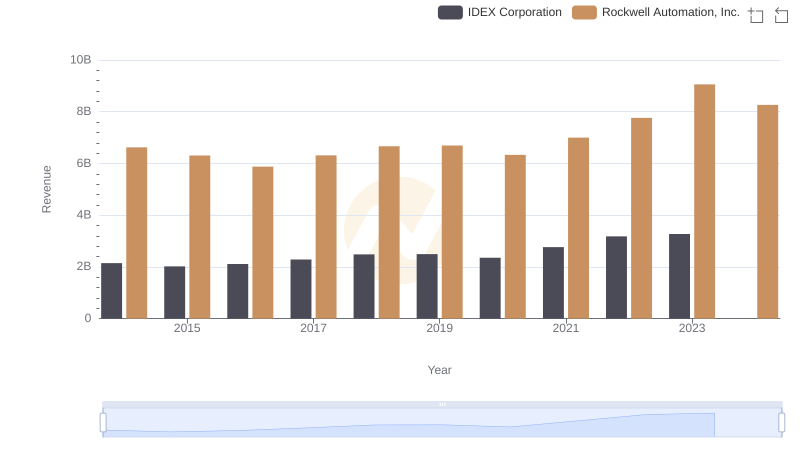
Comparing Revenue Performance: Rockwell Automation, Inc. or IDEX Corporation?
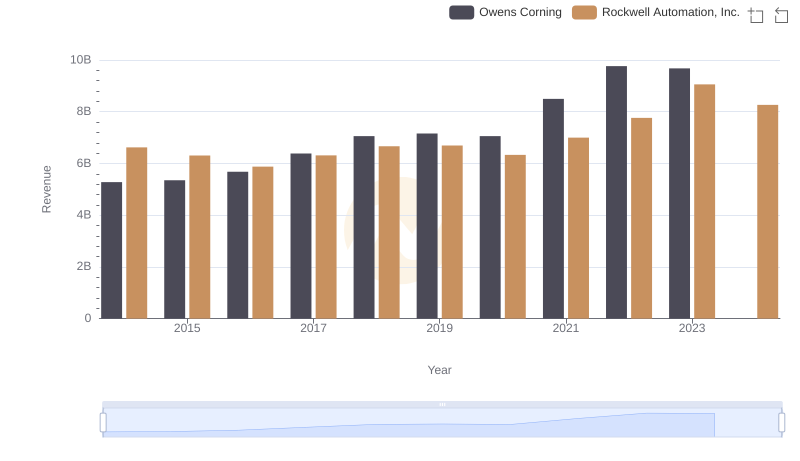
Who Generates More Revenue? Rockwell Automation, Inc. or Owens Corning
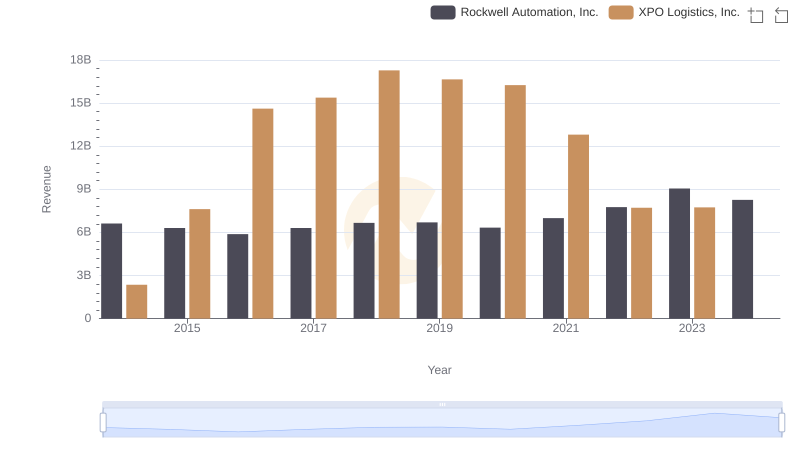
Revenue Showdown: Rockwell Automation, Inc. vs XPO Logistics, Inc.
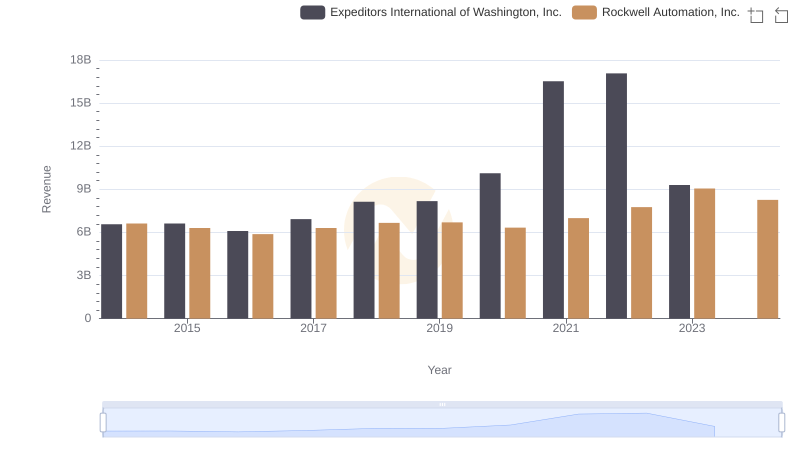
Comparing Revenue Performance: Rockwell Automation, Inc. or Expeditors International of Washington, Inc.?
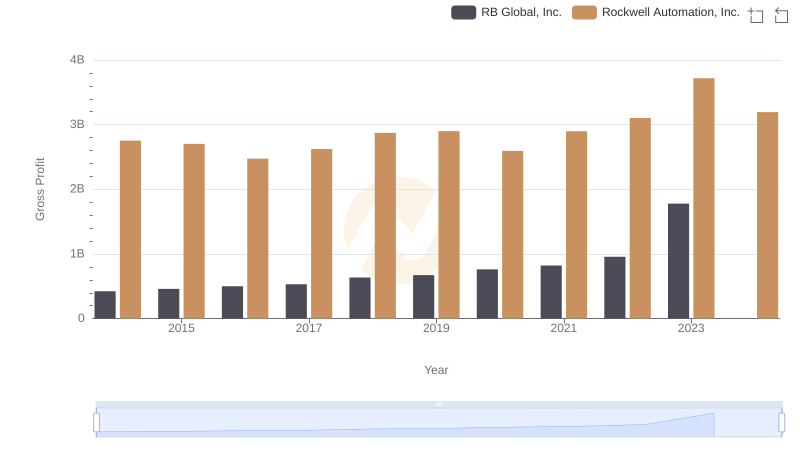
Gross Profit Trends Compared: Rockwell Automation, Inc. vs RB Global, Inc.
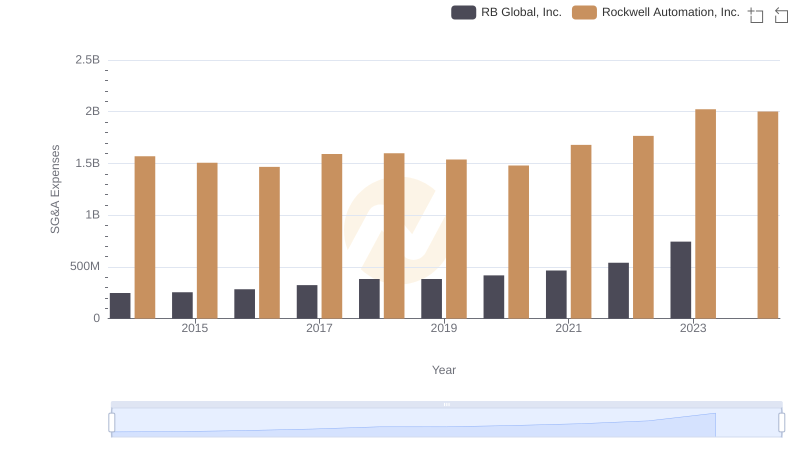
SG&A Efficiency Analysis: Comparing Rockwell Automation, Inc. and RB Global, Inc.
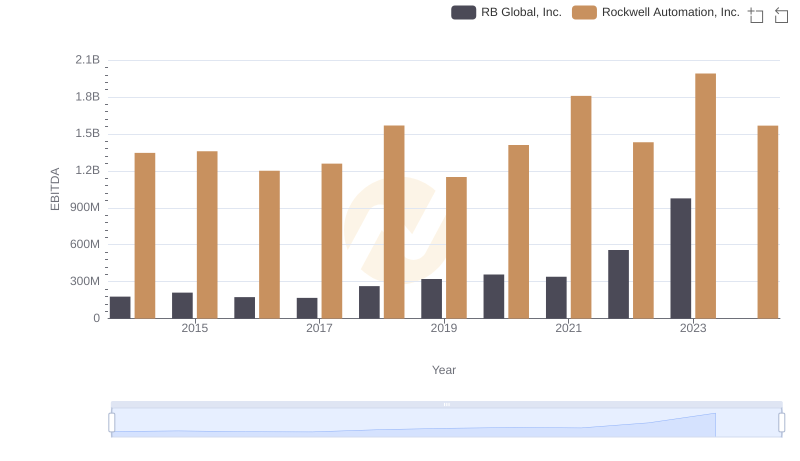
Rockwell Automation, Inc. and RB Global, Inc.: A Detailed Examination of EBITDA Performance