| __timestamp | Expeditors International of Washington, Inc. | Rockwell Automation, Inc. |
|---|---|---|
| Wednesday, January 1, 2014 | 6564721000 | 6623500000 |
| Thursday, January 1, 2015 | 6616632000 | 6307900000 |
| Friday, January 1, 2016 | 6098037000 | 5879500000 |
| Sunday, January 1, 2017 | 6920948000 | 6311300000 |
| Monday, January 1, 2018 | 8138365000 | 6666000000 |
| Tuesday, January 1, 2019 | 8175426000 | 6694800000 |
| Wednesday, January 1, 2020 | 10116481000 | 6329800000 |
| Friday, January 1, 2021 | 16523517000 | 6997400000 |
| Saturday, January 1, 2022 | 17071284000 | 7760400000 |
| Sunday, January 1, 2023 | 9300110000 | 9058000000 |
| Monday, January 1, 2024 | 10600515000 | 8264200000 |
Unveiling the hidden dimensions of data
In the ever-evolving landscape of industrial automation and logistics, Rockwell Automation, Inc. and Expeditors International of Washington, Inc. have showcased remarkable revenue trajectories over the past decade. From 2014 to 2023, Expeditors International experienced a robust growth, with revenue peaking at approximately $17 billion in 2022, marking a staggering 160% increase from its 2014 figures. Meanwhile, Rockwell Automation demonstrated steady growth, reaching nearly $9 billion in 2023, a 37% rise from 2014.
The year 2020 marked a pivotal point for Expeditors, with revenue surging by 63% compared to the previous year, likely driven by the global shift in supply chain dynamics. Rockwell Automation, while not as volatile, showed consistent growth, reflecting its stable position in the industrial sector. Notably, 2024 data for Expeditors is missing, leaving room for speculation on its future trajectory.
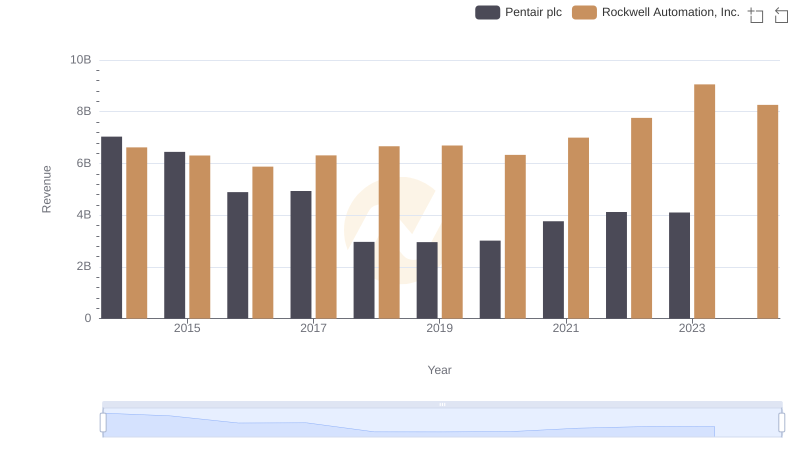
Revenue Insights: Rockwell Automation, Inc. and Pentair plc Performance Compared
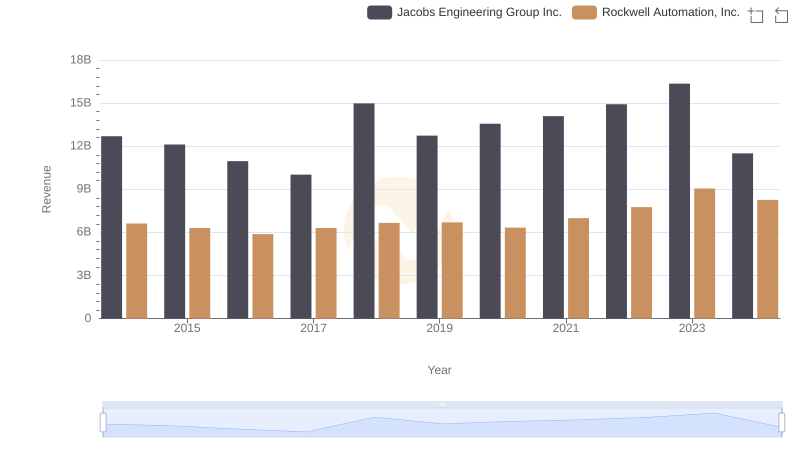
Rockwell Automation, Inc. vs Jacobs Engineering Group Inc.: Annual Revenue Growth Compared
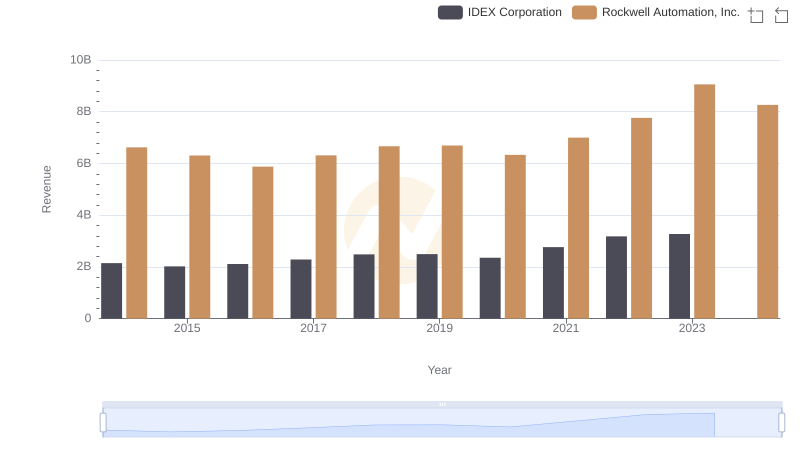
Comparing Revenue Performance: Rockwell Automation, Inc. or IDEX Corporation?
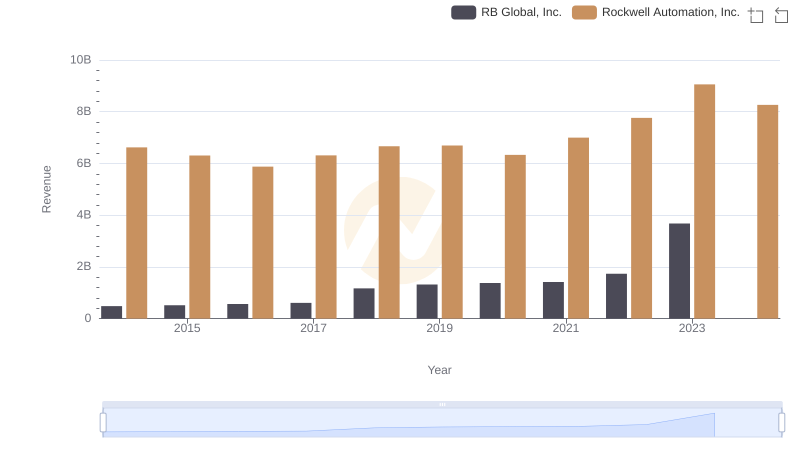
Rockwell Automation, Inc. and RB Global, Inc.: A Comprehensive Revenue Analysis
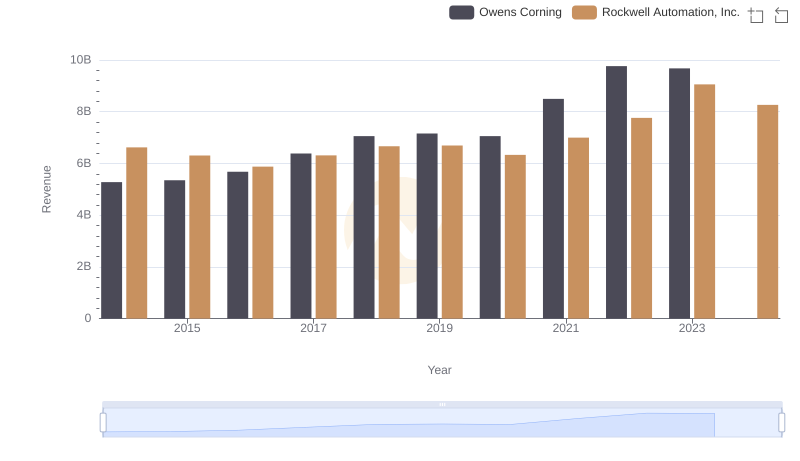
Who Generates More Revenue? Rockwell Automation, Inc. or Owens Corning
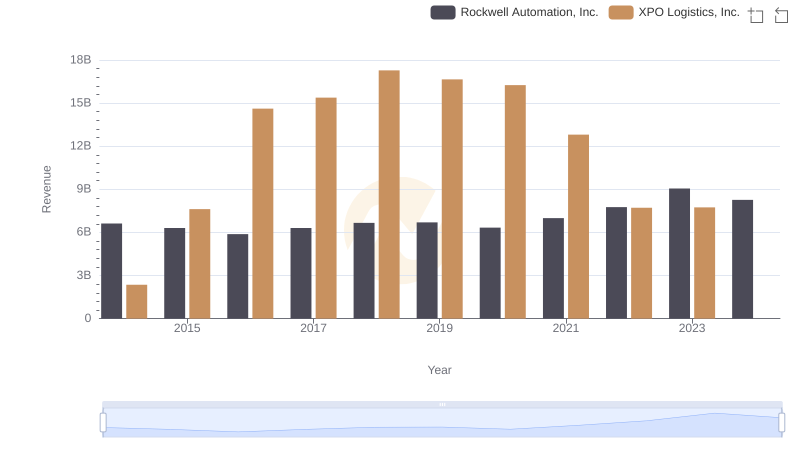
Revenue Showdown: Rockwell Automation, Inc. vs XPO Logistics, Inc.
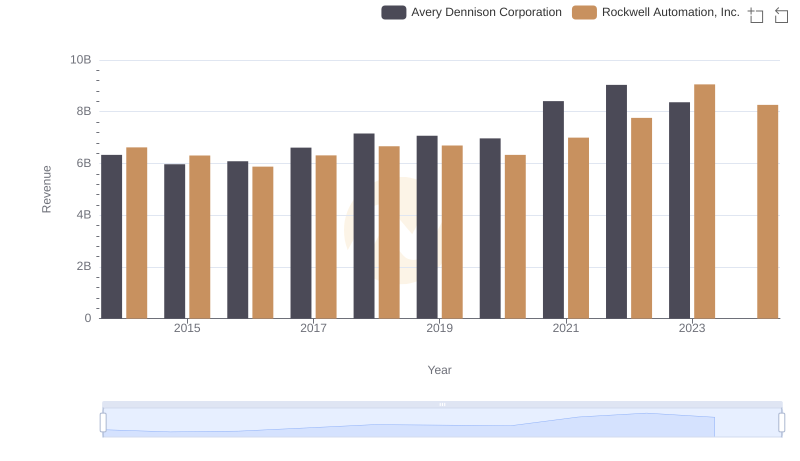
Rockwell Automation, Inc. or Avery Dennison Corporation: Who Leads in Yearly Revenue?
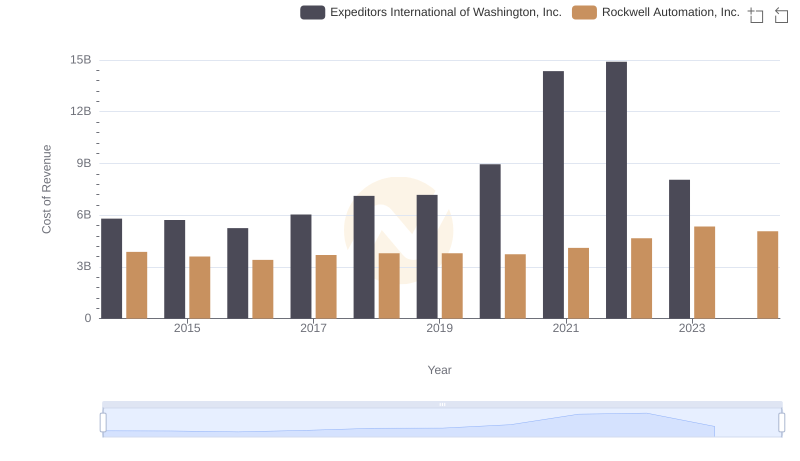
Analyzing Cost of Revenue: Rockwell Automation, Inc. and Expeditors International of Washington, Inc.

Gross Profit Comparison: Rockwell Automation, Inc. and Expeditors International of Washington, Inc. Trends

Cost Management Insights: SG&A Expenses for Rockwell Automation, Inc. and Expeditors International of Washington, Inc.

A Professional Review of EBITDA: Rockwell Automation, Inc. Compared to Expeditors International of Washington, Inc.