| __timestamp | Owens Corning | Rockwell Automation, Inc. |
|---|---|---|
| Wednesday, January 1, 2014 | 76000000 | 290100000 |
| Thursday, January 1, 2015 | 73000000 | 307300000 |
| Friday, January 1, 2016 | 82000000 | 319300000 |
| Sunday, January 1, 2017 | 85000000 | 348200000 |
| Monday, January 1, 2018 | 89000000 | 371800000 |
| Tuesday, January 1, 2019 | 87000000 | 378900000 |
| Wednesday, January 1, 2020 | 82000000 | 371500000 |
| Friday, January 1, 2021 | 91000000 | 422500000 |
| Saturday, January 1, 2022 | 106000000 | 440900000 |
| Sunday, January 1, 2023 | 123000000 | 529500000 |
| Monday, January 1, 2024 | 477300000 |
Unleashing the power of data
In the ever-evolving landscape of industrial innovation, research and development (R&D) spending is a key indicator of a company's commitment to future growth. Over the past decade, Rockwell Automation, Inc. has consistently outpaced Owens Corning in R&D investment. From 2014 to 2023, Rockwell Automation's R&D expenses surged by approximately 82%, peaking at an impressive $529 million in 2023. In contrast, Owens Corning's R&D spending grew by about 62% during the same period, reaching $123 million in 2023.
This trend highlights Rockwell Automation's strategic focus on technological advancement, particularly in automation and control systems. Meanwhile, Owens Corning, a leader in building materials, has shown steady growth in R&D, reflecting its commitment to innovation in sustainable materials. As we look to the future, these investments will likely shape the competitive landscape, driving both companies toward new frontiers of innovation.
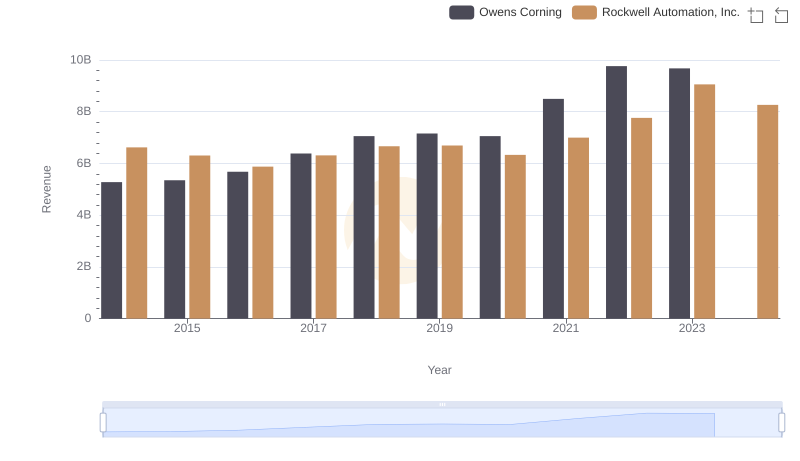
Who Generates More Revenue? Rockwell Automation, Inc. or Owens Corning
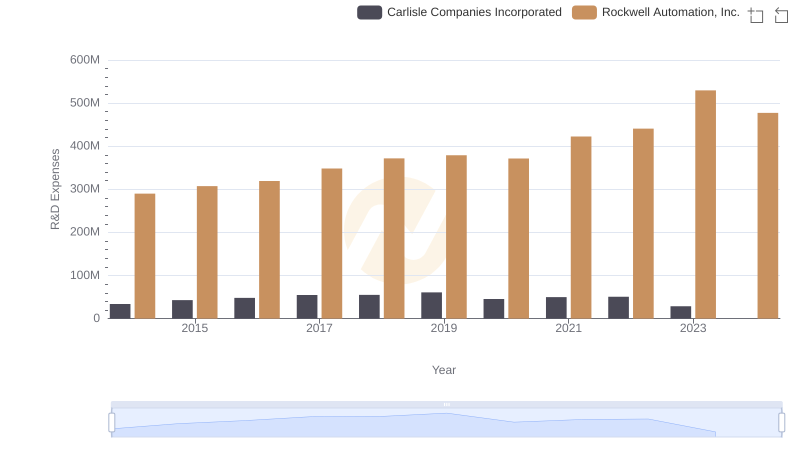
Rockwell Automation, Inc. or Carlisle Companies Incorporated: Who Invests More in Innovation?
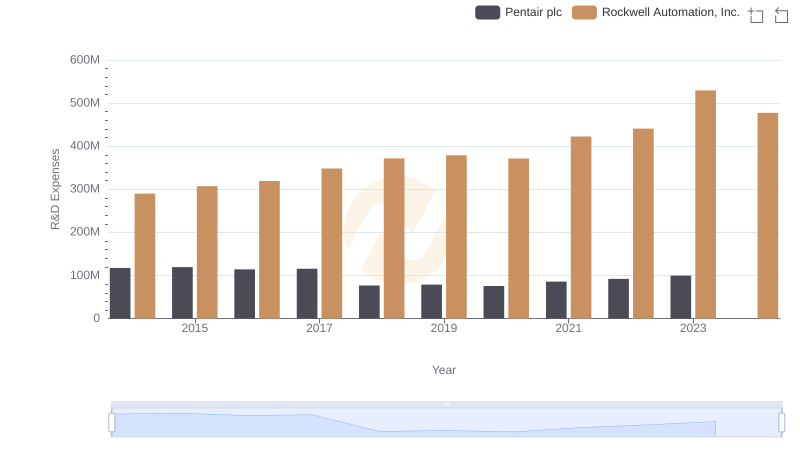
Research and Development: Comparing Key Metrics for Rockwell Automation, Inc. and Pentair plc
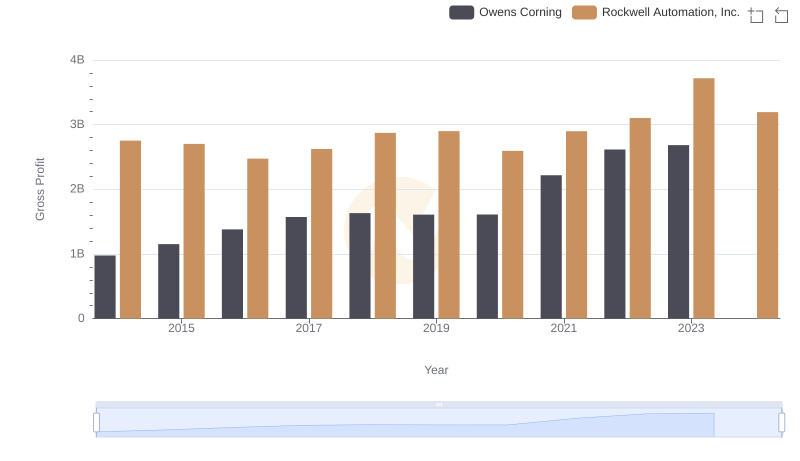
Gross Profit Trends Compared: Rockwell Automation, Inc. vs Owens Corning
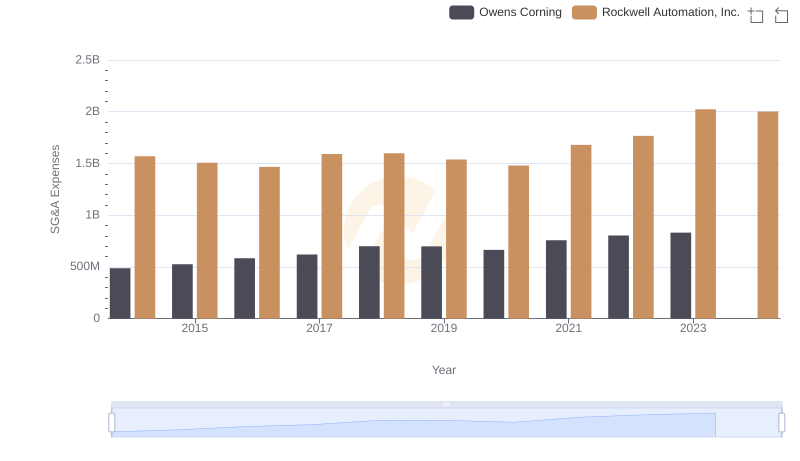
Operational Costs Compared: SG&A Analysis of Rockwell Automation, Inc. and Owens Corning
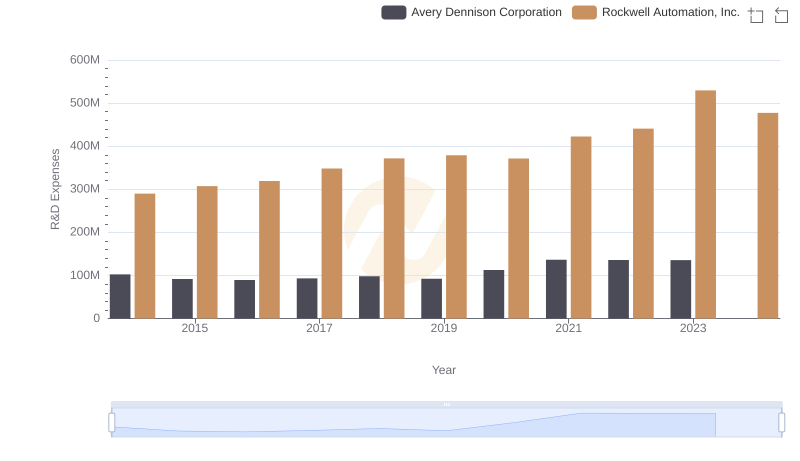
R&D Insights: How Rockwell Automation, Inc. and Avery Dennison Corporation Allocate Funds
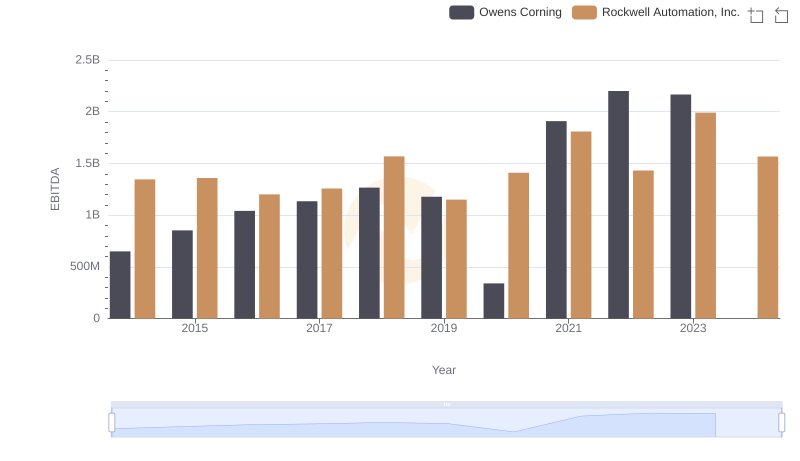
EBITDA Analysis: Evaluating Rockwell Automation, Inc. Against Owens Corning
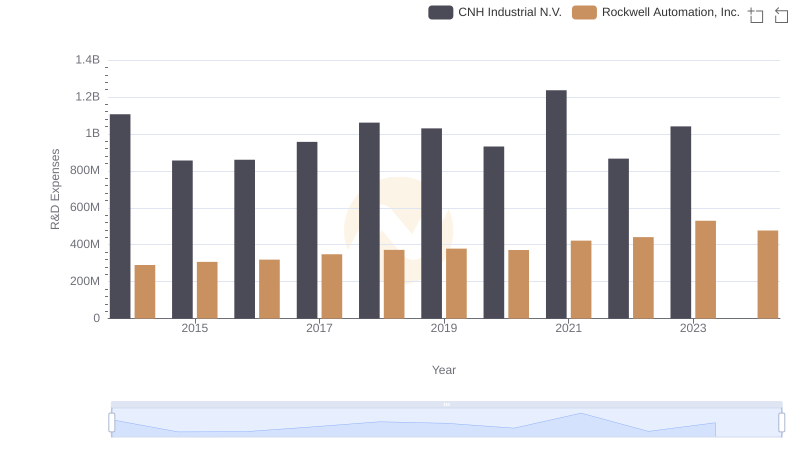
Research and Development Expenses Breakdown: Rockwell Automation, Inc. vs CNH Industrial N.V.
Research and Development Expenses Breakdown: Rockwell Automation, Inc. vs Graco Inc.