| __timestamp | Jacobs Engineering Group Inc. | Rockwell Automation, Inc. |
|---|---|---|
| Wednesday, January 1, 2014 | 12695157000 | 6623500000 |
| Thursday, January 1, 2015 | 12114832000 | 6307900000 |
| Friday, January 1, 2016 | 10964157000 | 5879500000 |
| Sunday, January 1, 2017 | 10022788000 | 6311300000 |
| Monday, January 1, 2018 | 14984646000 | 6666000000 |
| Tuesday, January 1, 2019 | 12737868000 | 6694800000 |
| Wednesday, January 1, 2020 | 13566975000 | 6329800000 |
| Friday, January 1, 2021 | 14092632000 | 6997400000 |
| Saturday, January 1, 2022 | 14922825000 | 7760400000 |
| Sunday, January 1, 2023 | 16352414000 | 9058000000 |
| Monday, January 1, 2024 | 11500941000 | 8264200000 |
Cracking the code
In the ever-evolving landscape of industrial automation and engineering, Rockwell Automation and Jacobs Engineering have been pivotal players. Over the past decade, these companies have showcased contrasting revenue trajectories. From 2014 to 2023, Rockwell Automation's revenue surged by approximately 37%, peaking in 2023. This growth reflects the increasing demand for automation solutions in a tech-driven world. In contrast, Jacobs Engineering experienced a more volatile journey, with a notable dip in 2024, marking a 30% decrease from its 2023 peak. This fluctuation could be attributed to shifting market dynamics and project cycles. As we look to the future, understanding these trends offers valuable insights into the industrial sector's direction. The data underscores the importance of adaptability and innovation in maintaining competitive advantage.
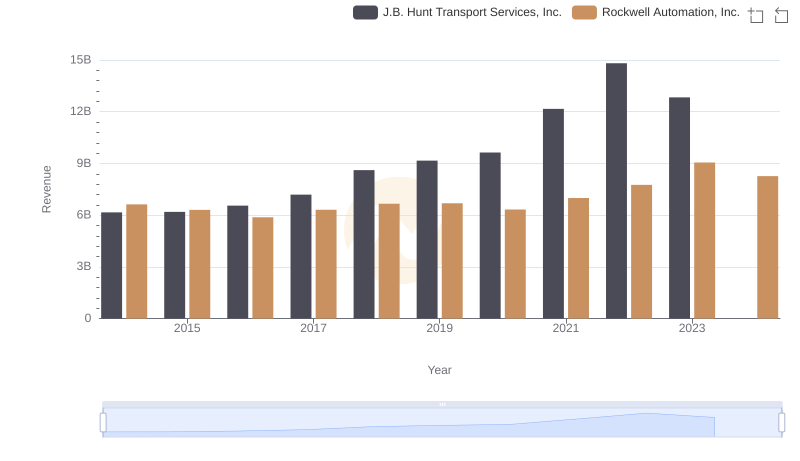
Rockwell Automation, Inc. vs J.B. Hunt Transport Services, Inc.: Annual Revenue Growth Compared
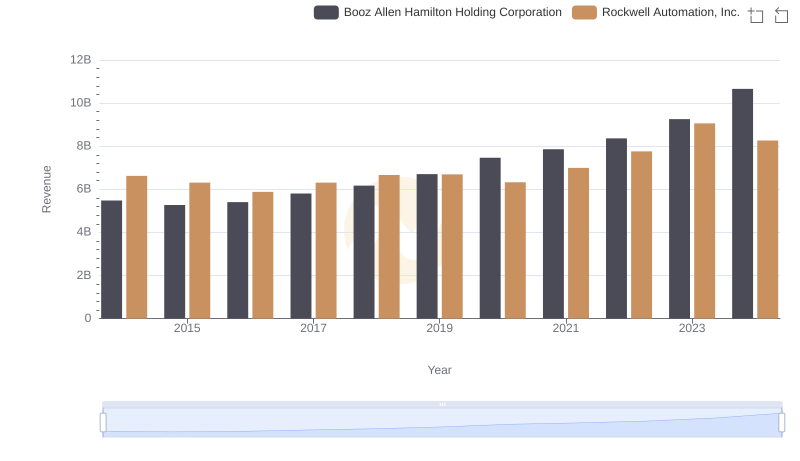
Breaking Down Revenue Trends: Rockwell Automation, Inc. vs Booz Allen Hamilton Holding Corporation
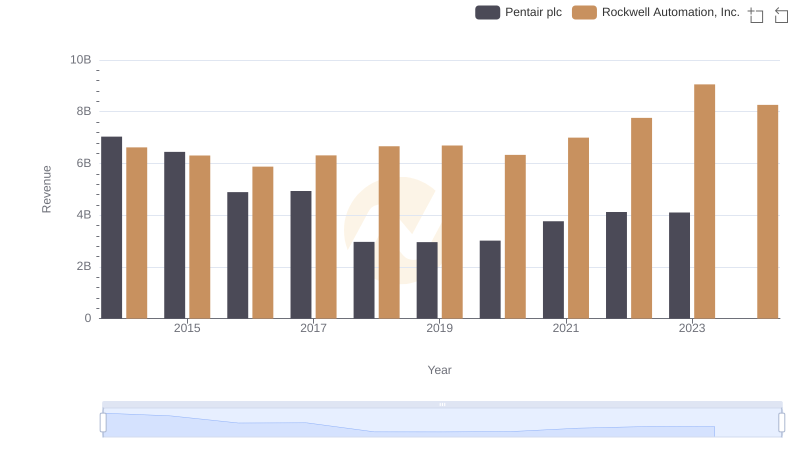
Revenue Insights: Rockwell Automation, Inc. and Pentair plc Performance Compared
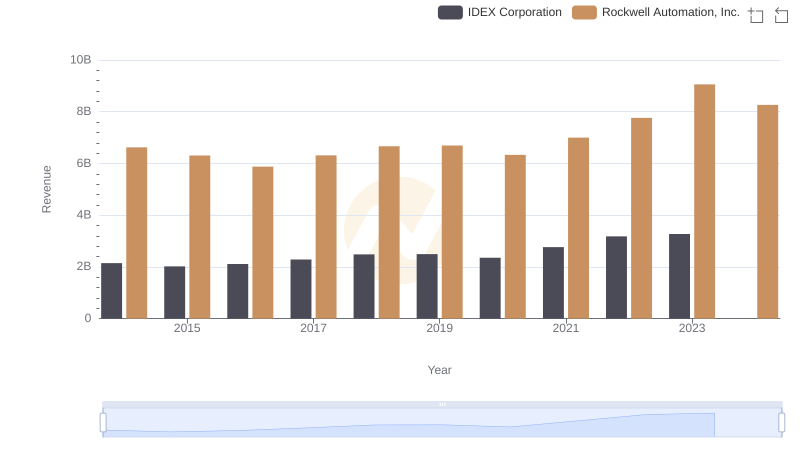
Comparing Revenue Performance: Rockwell Automation, Inc. or IDEX Corporation?
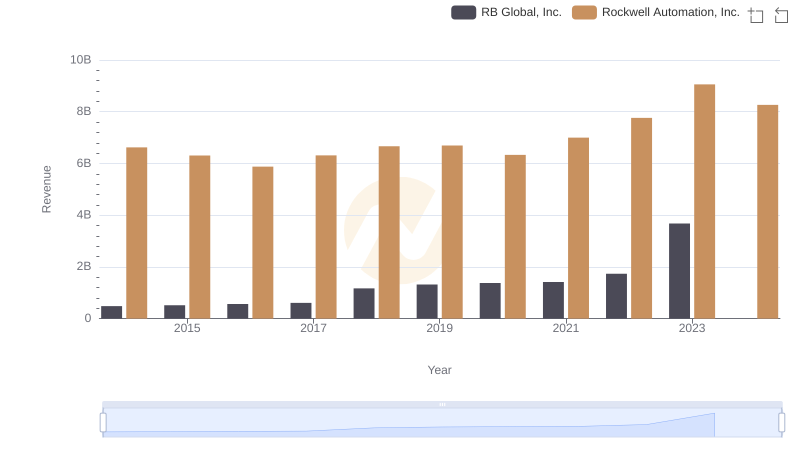
Rockwell Automation, Inc. and RB Global, Inc.: A Comprehensive Revenue Analysis
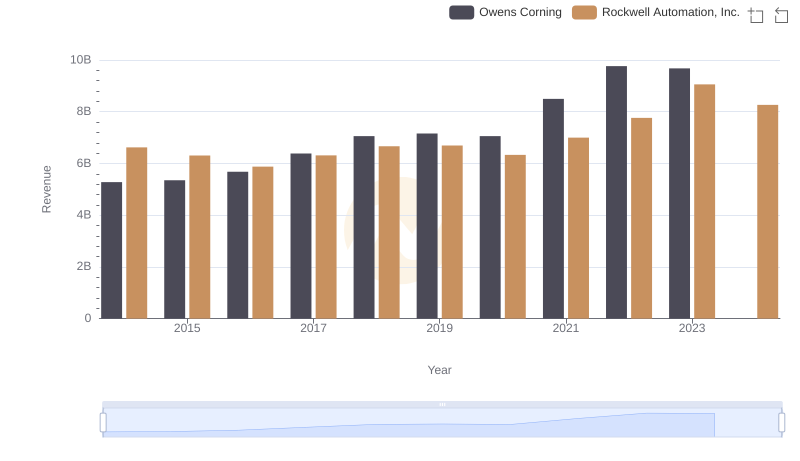
Who Generates More Revenue? Rockwell Automation, Inc. or Owens Corning
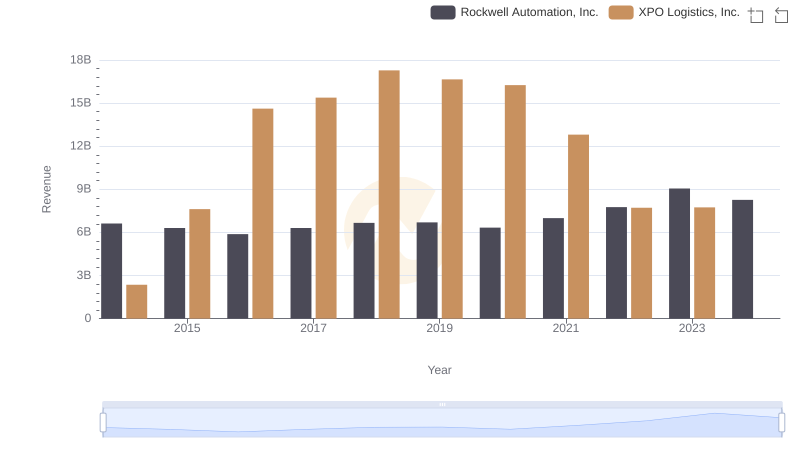
Revenue Showdown: Rockwell Automation, Inc. vs XPO Logistics, Inc.
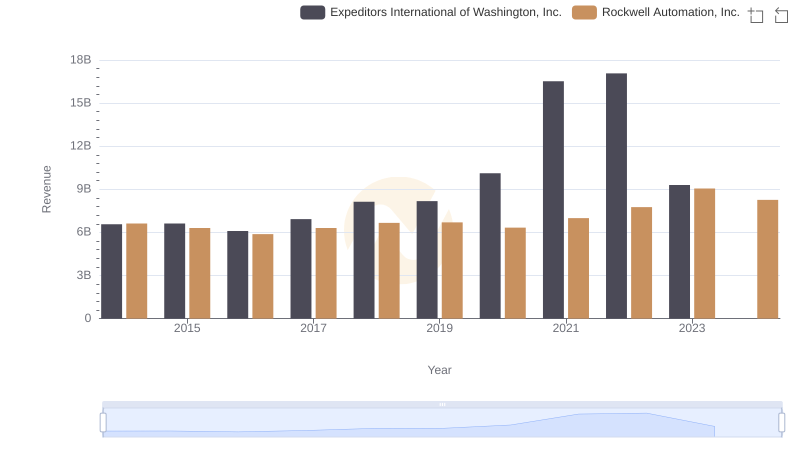
Comparing Revenue Performance: Rockwell Automation, Inc. or Expeditors International of Washington, Inc.?
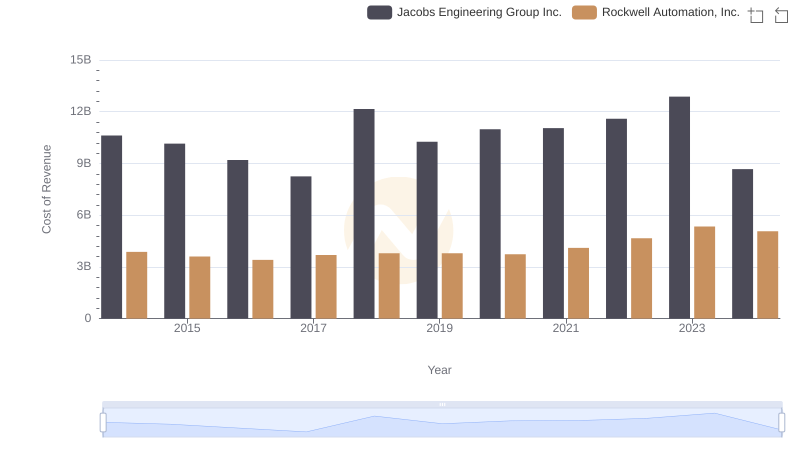
Cost of Revenue: Key Insights for Rockwell Automation, Inc. and Jacobs Engineering Group Inc.
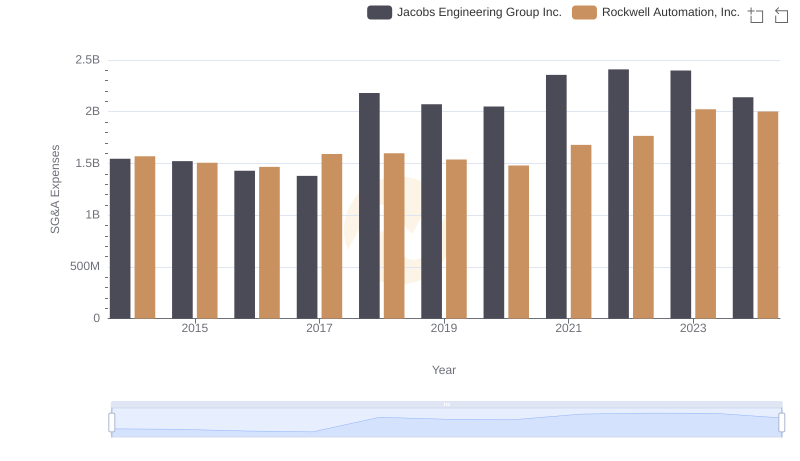
Rockwell Automation, Inc. vs Jacobs Engineering Group Inc.: SG&A Expense Trends
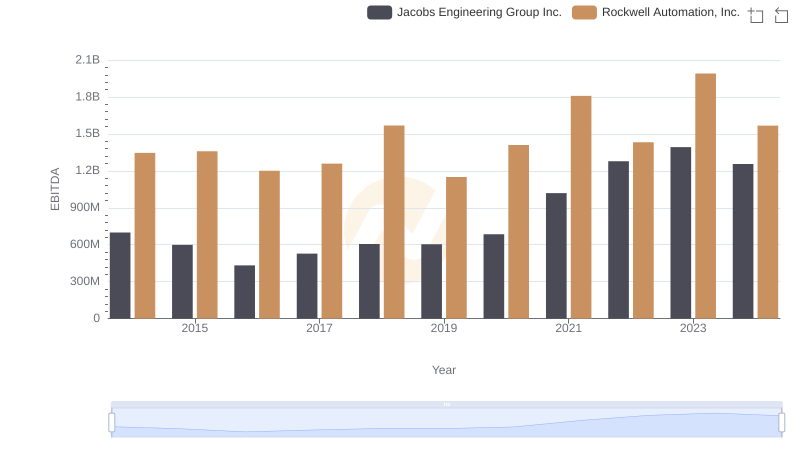
Rockwell Automation, Inc. vs Jacobs Engineering Group Inc.: In-Depth EBITDA Performance Comparison