| __timestamp | Owens Corning | Rockwell Automation, Inc. |
|---|---|---|
| Wednesday, January 1, 2014 | 976000000 | 2753900000 |
| Thursday, January 1, 2015 | 1153000000 | 2703100000 |
| Friday, January 1, 2016 | 1381000000 | 2475500000 |
| Sunday, January 1, 2017 | 1572000000 | 2624200000 |
| Monday, January 1, 2018 | 1632000000 | 2872200000 |
| Tuesday, January 1, 2019 | 1609000000 | 2900100000 |
| Wednesday, January 1, 2020 | 1610000000 | 2595200000 |
| Friday, January 1, 2021 | 2217000000 | 2897700000 |
| Saturday, January 1, 2022 | 2616000000 | 3102000000 |
| Sunday, January 1, 2023 | 2683000000 | 3717000000 |
| Monday, January 1, 2024 | 3193400000 |
Unlocking the unknown
In the competitive landscape of industrial automation and building materials, Rockwell Automation, Inc. and Owens Corning have showcased intriguing gross profit trends over the past decade. From 2014 to 2023, Rockwell Automation consistently outperformed Owens Corning, with gross profits peaking at approximately $3.7 billion in 2023, marking a 35% increase from 2014. Meanwhile, Owens Corning demonstrated a robust growth trajectory, achieving a 175% increase in gross profit, reaching around $2.7 billion in 2023. This remarkable growth underscores Owens Corning's strategic advancements in the building materials sector. However, the data for 2024 remains incomplete, leaving room for speculation on future trends. As these industry leaders continue to innovate, their financial performances will be pivotal in shaping the market dynamics. Stay tuned for more insights as we delve deeper into the financial narratives of these corporate titans.
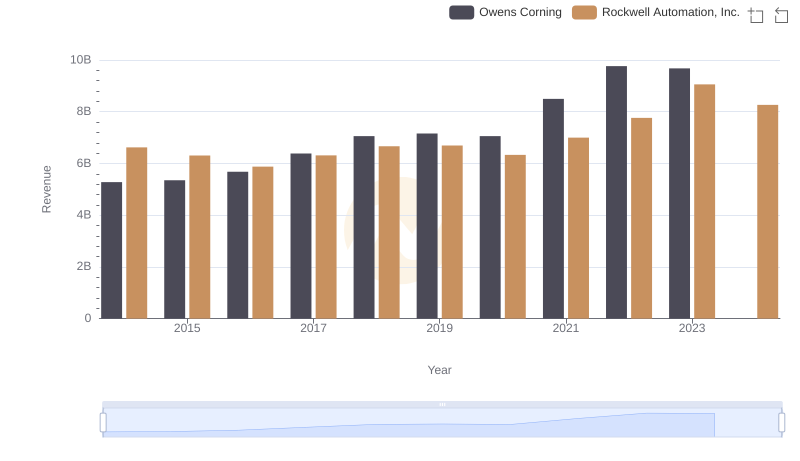
Who Generates More Revenue? Rockwell Automation, Inc. or Owens Corning
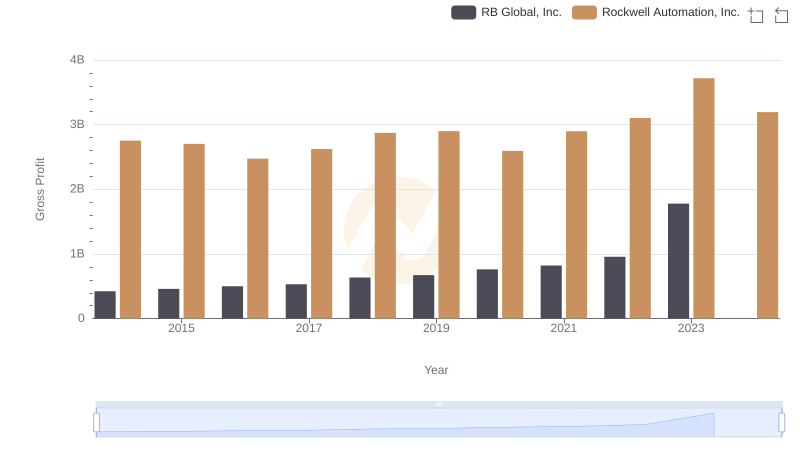
Gross Profit Trends Compared: Rockwell Automation, Inc. vs RB Global, Inc.
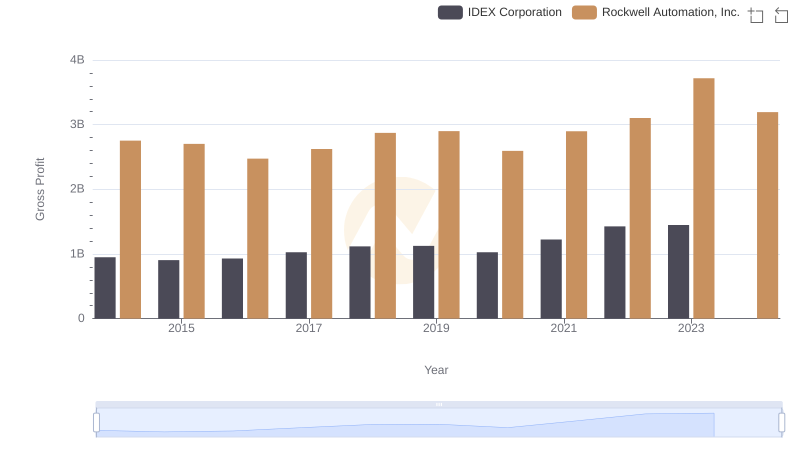
Rockwell Automation, Inc. and IDEX Corporation: A Detailed Gross Profit Analysis
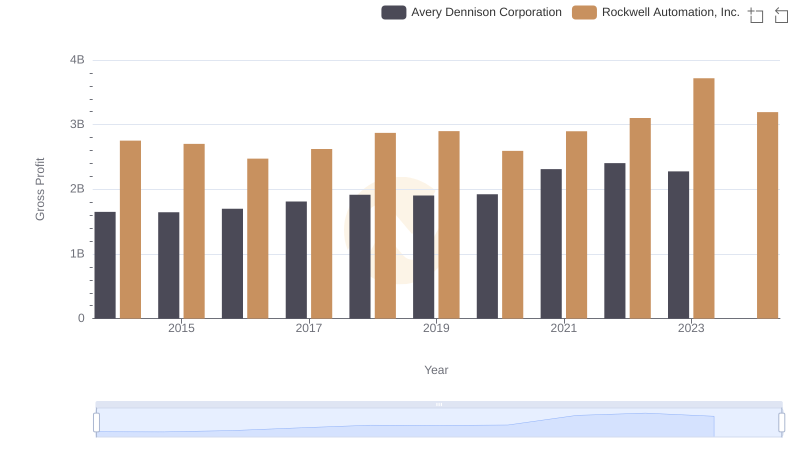
Gross Profit Trends Compared: Rockwell Automation, Inc. vs Avery Dennison Corporation

Gross Profit Comparison: Rockwell Automation, Inc. and Expeditors International of Washington, Inc. Trends
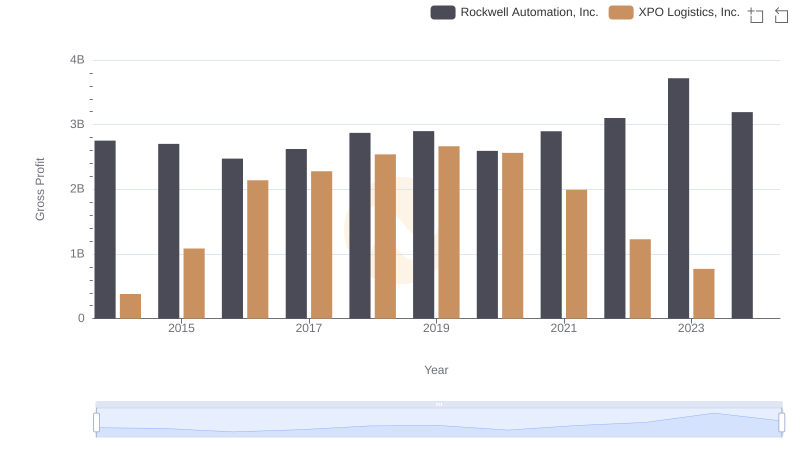
Gross Profit Trends Compared: Rockwell Automation, Inc. vs XPO Logistics, Inc.
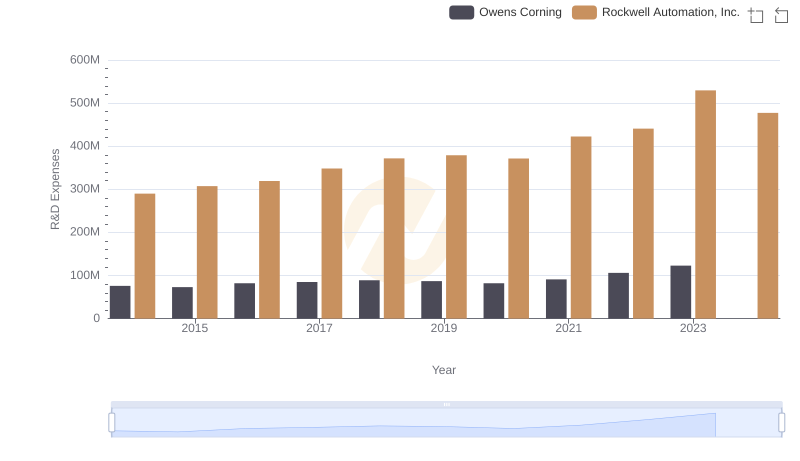
R&D Spending Showdown: Rockwell Automation, Inc. vs Owens Corning
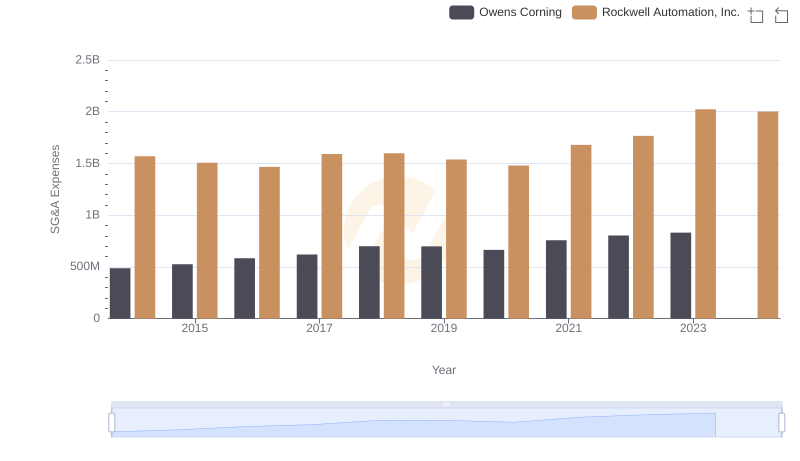
Operational Costs Compared: SG&A Analysis of Rockwell Automation, Inc. and Owens Corning
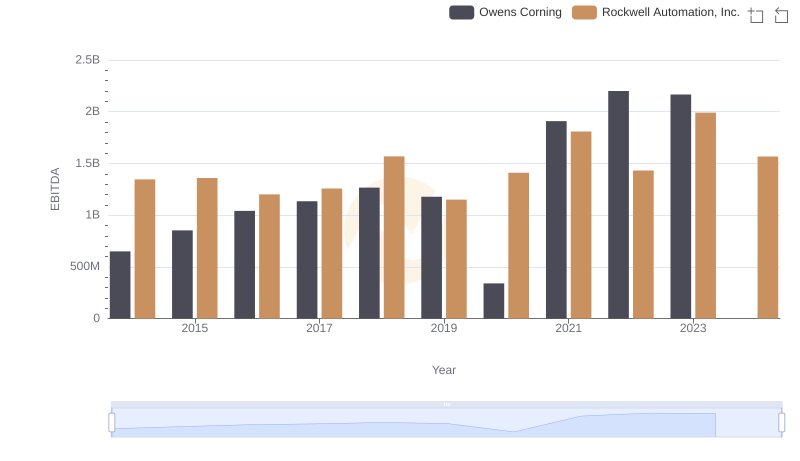
EBITDA Analysis: Evaluating Rockwell Automation, Inc. Against Owens Corning