| __timestamp | Masco Corporation | Waste Connections, Inc. |
|---|---|---|
| Wednesday, January 1, 2014 | 2387000000 | 940778000 |
| Thursday, January 1, 2015 | 2253000000 | 939878000 |
| Friday, January 1, 2016 | 2456000000 | 1418151000 |
| Sunday, January 1, 2017 | 2611000000 | 1925713000 |
| Monday, January 1, 2018 | 2689000000 | 2057237000 |
| Tuesday, January 1, 2019 | 2371000000 | 2189922000 |
| Wednesday, January 1, 2020 | 2587000000 | 2169182000 |
| Friday, January 1, 2021 | 2863000000 | 2497287000 |
| Saturday, January 1, 2022 | 2713000000 | 2875847000 |
| Sunday, January 1, 2023 | 2836000000 | 3277438000 |
| Monday, January 1, 2024 | 2831000000 | 3727885000 |
Data in motion
In the ever-evolving landscape of corporate finance, understanding the trajectory of gross profits is crucial for investors and analysts alike. Over the past decade, Waste Connections, Inc. and Masco Corporation have showcased intriguing trends in their financial performance.
From 2014 to 2023, Waste Connections, Inc. has seen a remarkable growth in gross profit, surging by approximately 248%, from just under $1 billion to over $3.2 billion. This growth reflects the company's strategic expansions and operational efficiencies. In contrast, Masco Corporation, a leader in home improvement and building products, has experienced a steadier growth of around 19% over the same period, with gross profits rising from $2.4 billion to $2.8 billion.
These trends highlight the dynamic nature of the industries these companies operate in, with Waste Connections benefiting from increased demand for waste management services, while Masco continues to capitalize on the robust housing market.
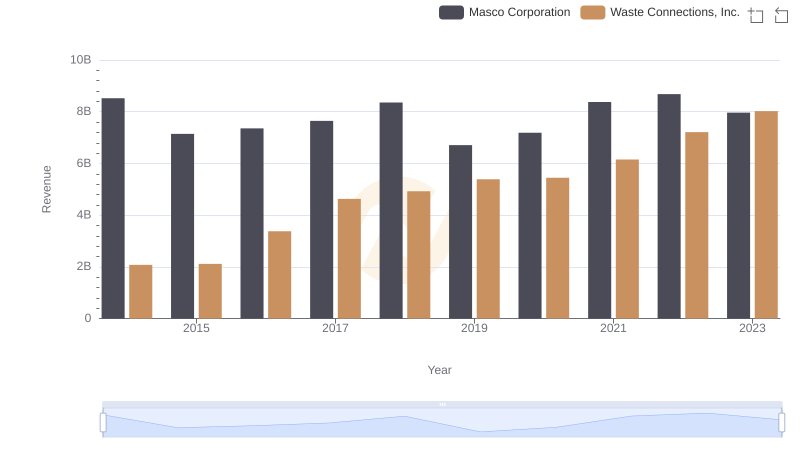
Comparing Revenue Performance: Waste Connections, Inc. or Masco Corporation?
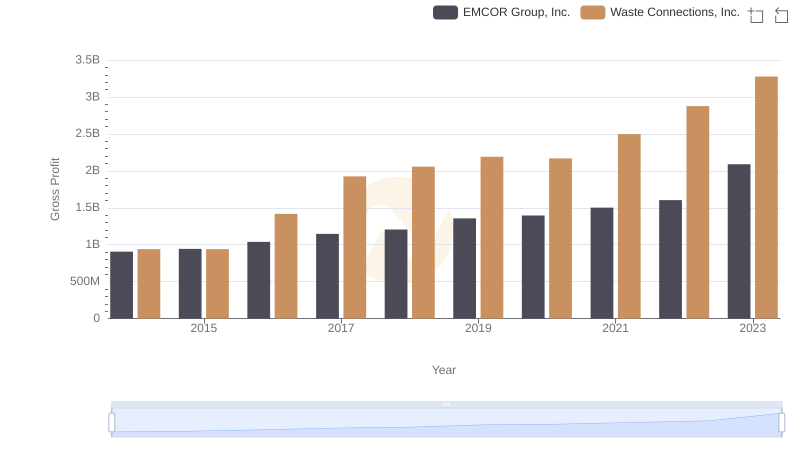
Gross Profit Trends Compared: Waste Connections, Inc. vs EMCOR Group, Inc.
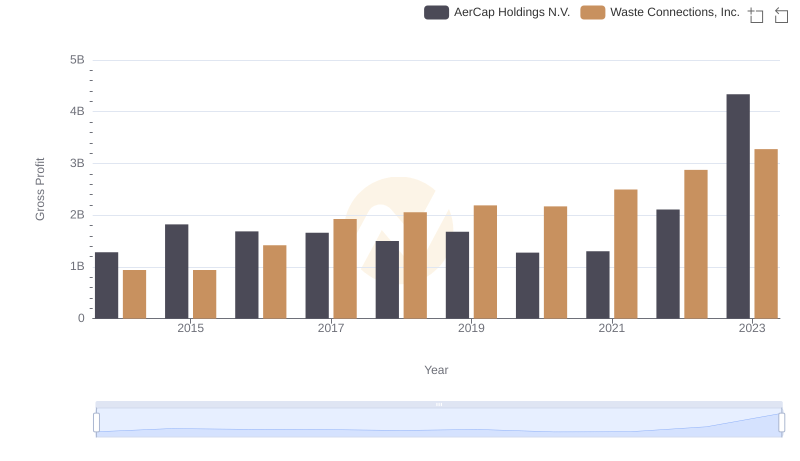
Who Generates Higher Gross Profit? Waste Connections, Inc. or AerCap Holdings N.V.
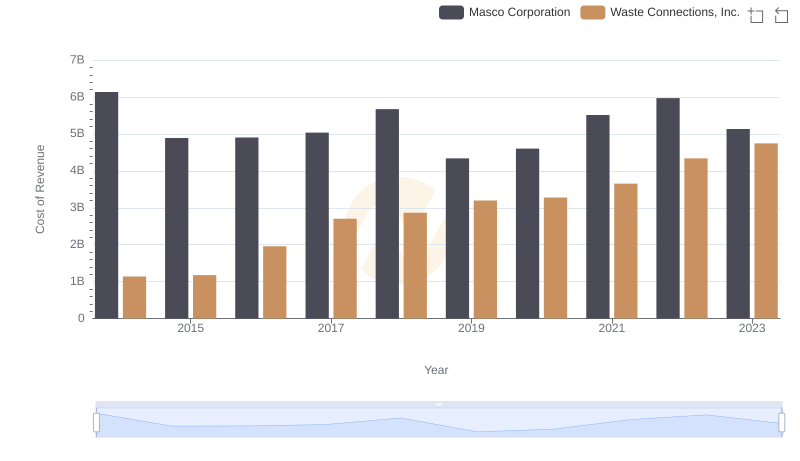
Cost of Revenue Comparison: Waste Connections, Inc. vs Masco Corporation
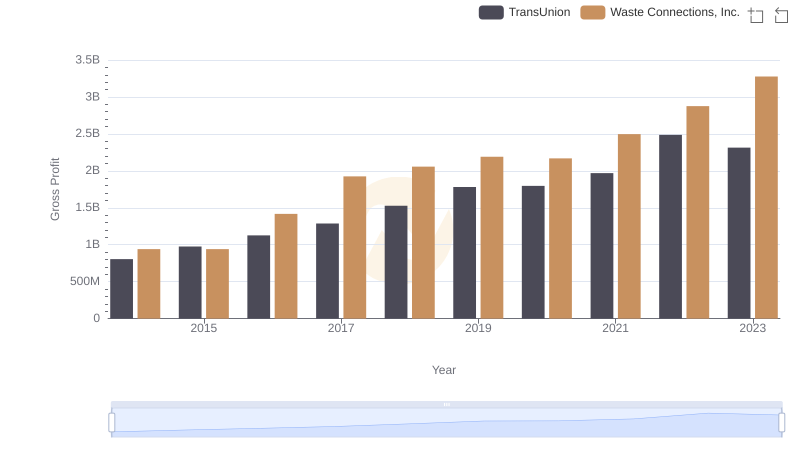
Who Generates Higher Gross Profit? Waste Connections, Inc. or TransUnion

Who Generates Higher Gross Profit? Waste Connections, Inc. or Stanley Black & Decker, Inc.
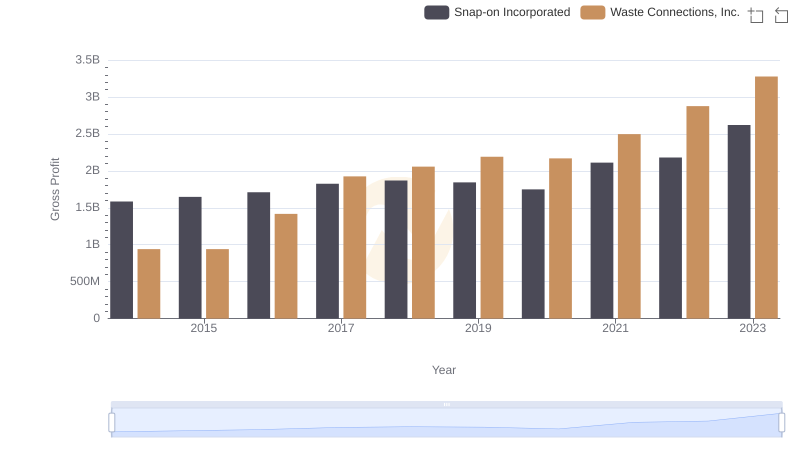
Waste Connections, Inc. vs Snap-on Incorporated: A Gross Profit Performance Breakdown
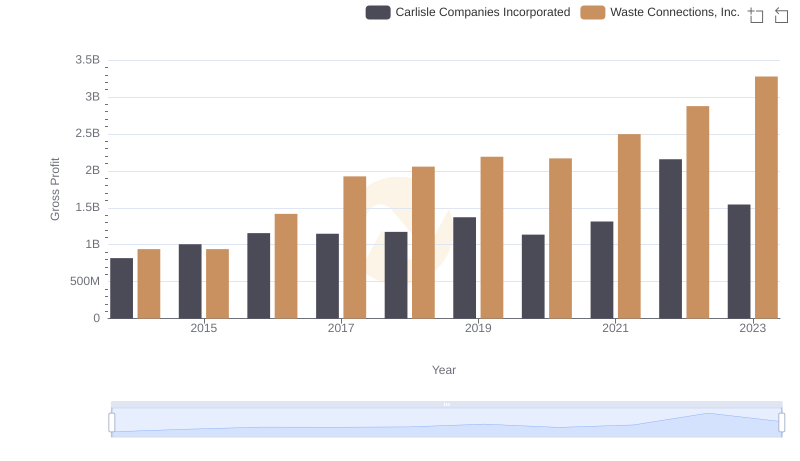
Gross Profit Analysis: Comparing Waste Connections, Inc. and Carlisle Companies Incorporated
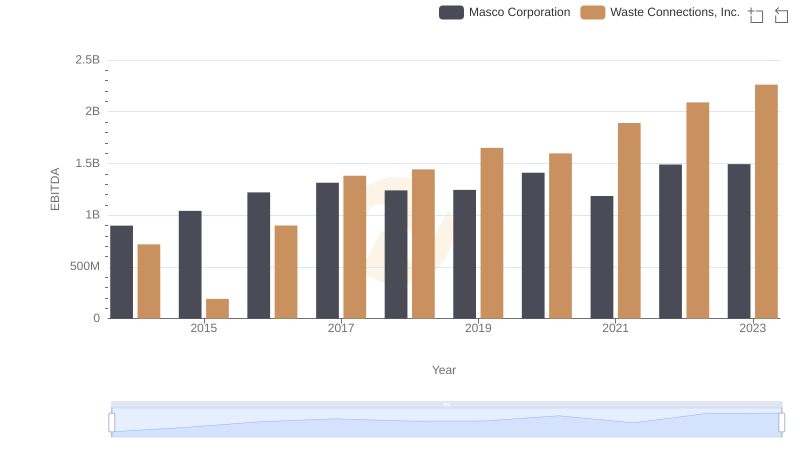
Comparative EBITDA Analysis: Waste Connections, Inc. vs Masco Corporation