| __timestamp | Snap-on Incorporated | Waste Connections, Inc. |
|---|---|---|
| Wednesday, January 1, 2014 | 1584300000 | 940778000 |
| Thursday, January 1, 2015 | 1648300000 | 939878000 |
| Friday, January 1, 2016 | 1709600000 | 1418151000 |
| Sunday, January 1, 2017 | 1824900000 | 1925713000 |
| Monday, January 1, 2018 | 1870000000 | 2057237000 |
| Tuesday, January 1, 2019 | 1844000000 | 2189922000 |
| Wednesday, January 1, 2020 | 1748500000 | 2169182000 |
| Friday, January 1, 2021 | 2110800000 | 2497287000 |
| Saturday, January 1, 2022 | 2181100000 | 2875847000 |
| Sunday, January 1, 2023 | 2619800000 | 3277438000 |
| Monday, January 1, 2024 | 2377900000 | 3727885000 |
Cracking the code
In the ever-evolving landscape of corporate America, Waste Connections, Inc. and Snap-on Incorporated have emerged as formidable players in their respective industries. Over the past decade, these companies have demonstrated remarkable growth in gross profit, reflecting their strategic prowess and market adaptability.
From 2014 to 2023, Waste Connections, Inc. has seen its gross profit soar by approximately 248%, culminating in a staggering $3.28 billion in 2023. This growth trajectory underscores the company's robust expansion and operational efficiency in the waste management sector.
Meanwhile, Snap-on Incorporated, a leader in the tools and equipment industry, has experienced a commendable 65% increase in gross profit over the same period, reaching $2.62 billion in 2023. This steady rise highlights Snap-on's resilience and innovation in a competitive market.
As these two giants continue to thrive, their financial performance offers valuable insights into the dynamics of their industries and the broader economic landscape.
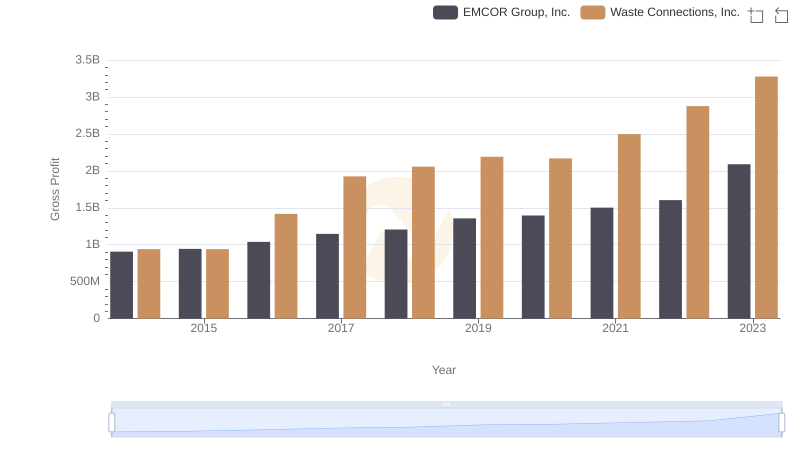
Gross Profit Trends Compared: Waste Connections, Inc. vs EMCOR Group, Inc.
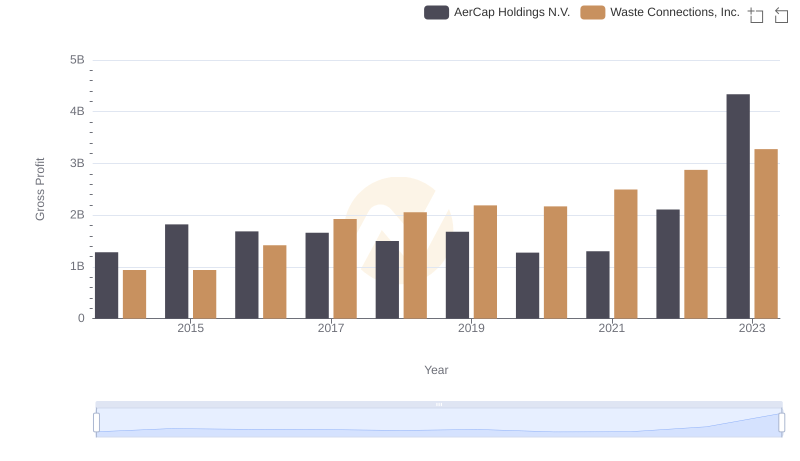
Who Generates Higher Gross Profit? Waste Connections, Inc. or AerCap Holdings N.V.
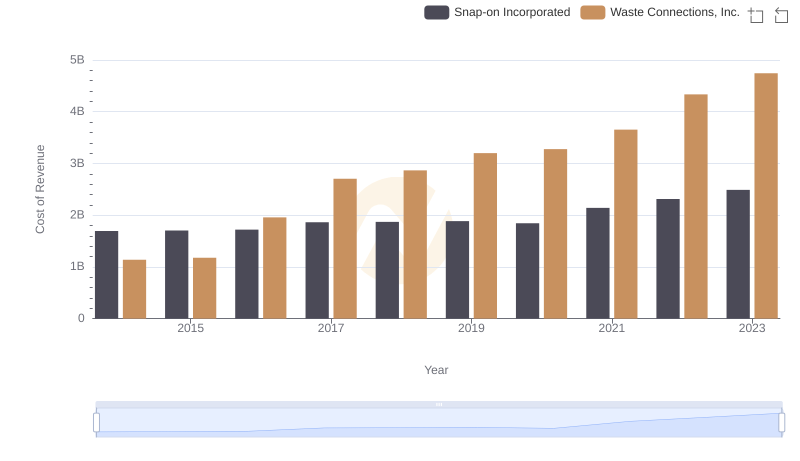
Waste Connections, Inc. vs Snap-on Incorporated: Efficiency in Cost of Revenue Explored
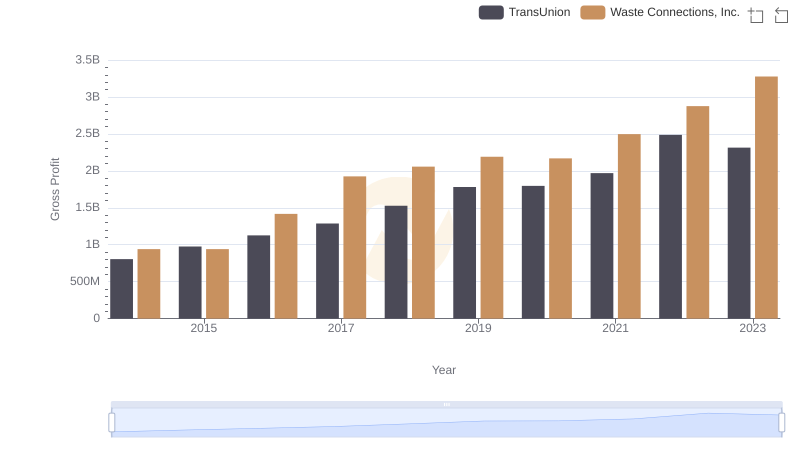
Who Generates Higher Gross Profit? Waste Connections, Inc. or TransUnion

Who Generates Higher Gross Profit? Waste Connections, Inc. or Stanley Black & Decker, Inc.
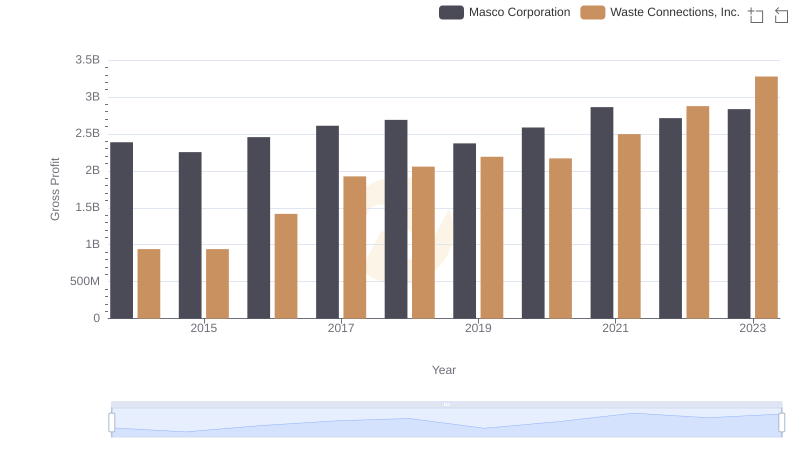
Gross Profit Trends Compared: Waste Connections, Inc. vs Masco Corporation
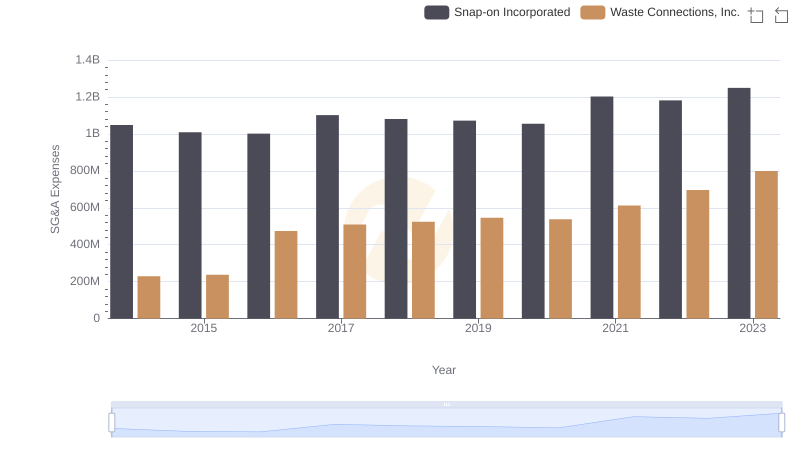
Operational Costs Compared: SG&A Analysis of Waste Connections, Inc. and Snap-on Incorporated
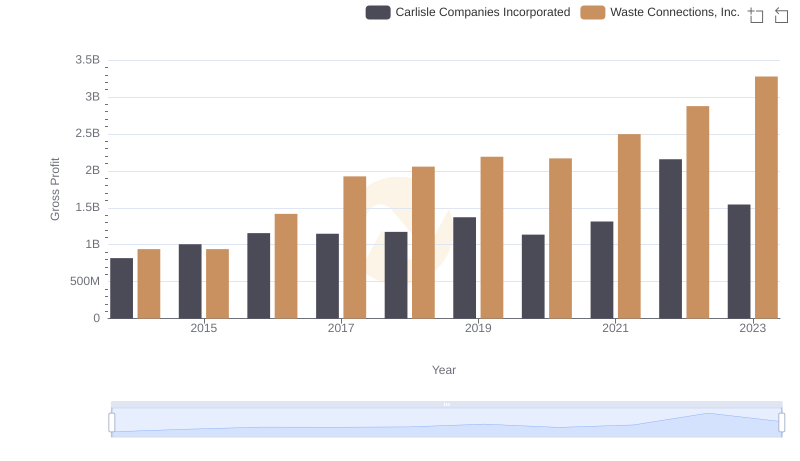
Gross Profit Analysis: Comparing Waste Connections, Inc. and Carlisle Companies Incorporated